Home ownership is one of the clearest measures of financial stability in the U.S., yet the gap between homeowners and renters is striking. According to the Census Bureau, housing units continue to grow, but homeownership rates shift each quarter, reflecting changes in income, credit scores, and demographics.
Recent data from the Federal Reserve shows how homeowners differ from renters in wealth and opportunity.
Median income and median net worth remain significantly higher among owner-occupied households. Renters statistics highlight that many renters live in urban areas, with one-third spending more than expected on housing.
In this guide, you’ll see how the national average compares with regional patterns, what the National Association reports about trends, and how households are changing year over year. We’ll cover homeownership rates, renters, and the factors shaping who buys and who rents.
Key U.S. Homeownership Statistics for 2025
National Homeownership Rate
Understanding current homeownership rates in the United States provides valuable insights into housing trends and economic dynamics.
Below are key statistics and factors related to the national homeownership rate:
- Approximately 66% of American households own their primary residence, reflecting stable ownership rates over recent years.
- Over 70% of homeowners belong to age groups 45 and older, showing that homeownership increases as individuals age.
- Young adults are more likely to rent, with many transitioning to owner-occupied housing later in life.
- Homeowners’ median household income is significantly higher than renting households, highlighting economic barriers for renters.
- Homeowners tend to have higher average credit scores, strengthening their ability to secure mortgages at favorable terms.
- States like West Virginia consistently report the highest percentages of owner-occupied units, while urban areas, such as New York, experience lower ownership levels due to elevated property prices.
- Hispanic households and Black Americans face lower homeownership rates compared to white households, reflecting demographic disparities revealed through Census Bureau data.
- Mortgage interest rates have risen recently, creating additional challenges for first-time buyers and reducing purchasing power.
- The national rental vacancy rate indicates increased availability in the rental market, offering more options for families delaying homeownership.
These numbers and trends reflect a range of social, economic, and regional factors that influence Americans’ housing decisions. Policymakers and industry professionals monitor these patterns to address affordability and support balanced growth in the real estate market.
Regional Differences in Homeownership & Renting in the U.S.
Homeownership and renting preferences shift significantly based on location within the United States. These regional distinctions often reflect differences in job markets, housing costs, and demographic trends.
A closer look at the data reveals notable patterns:
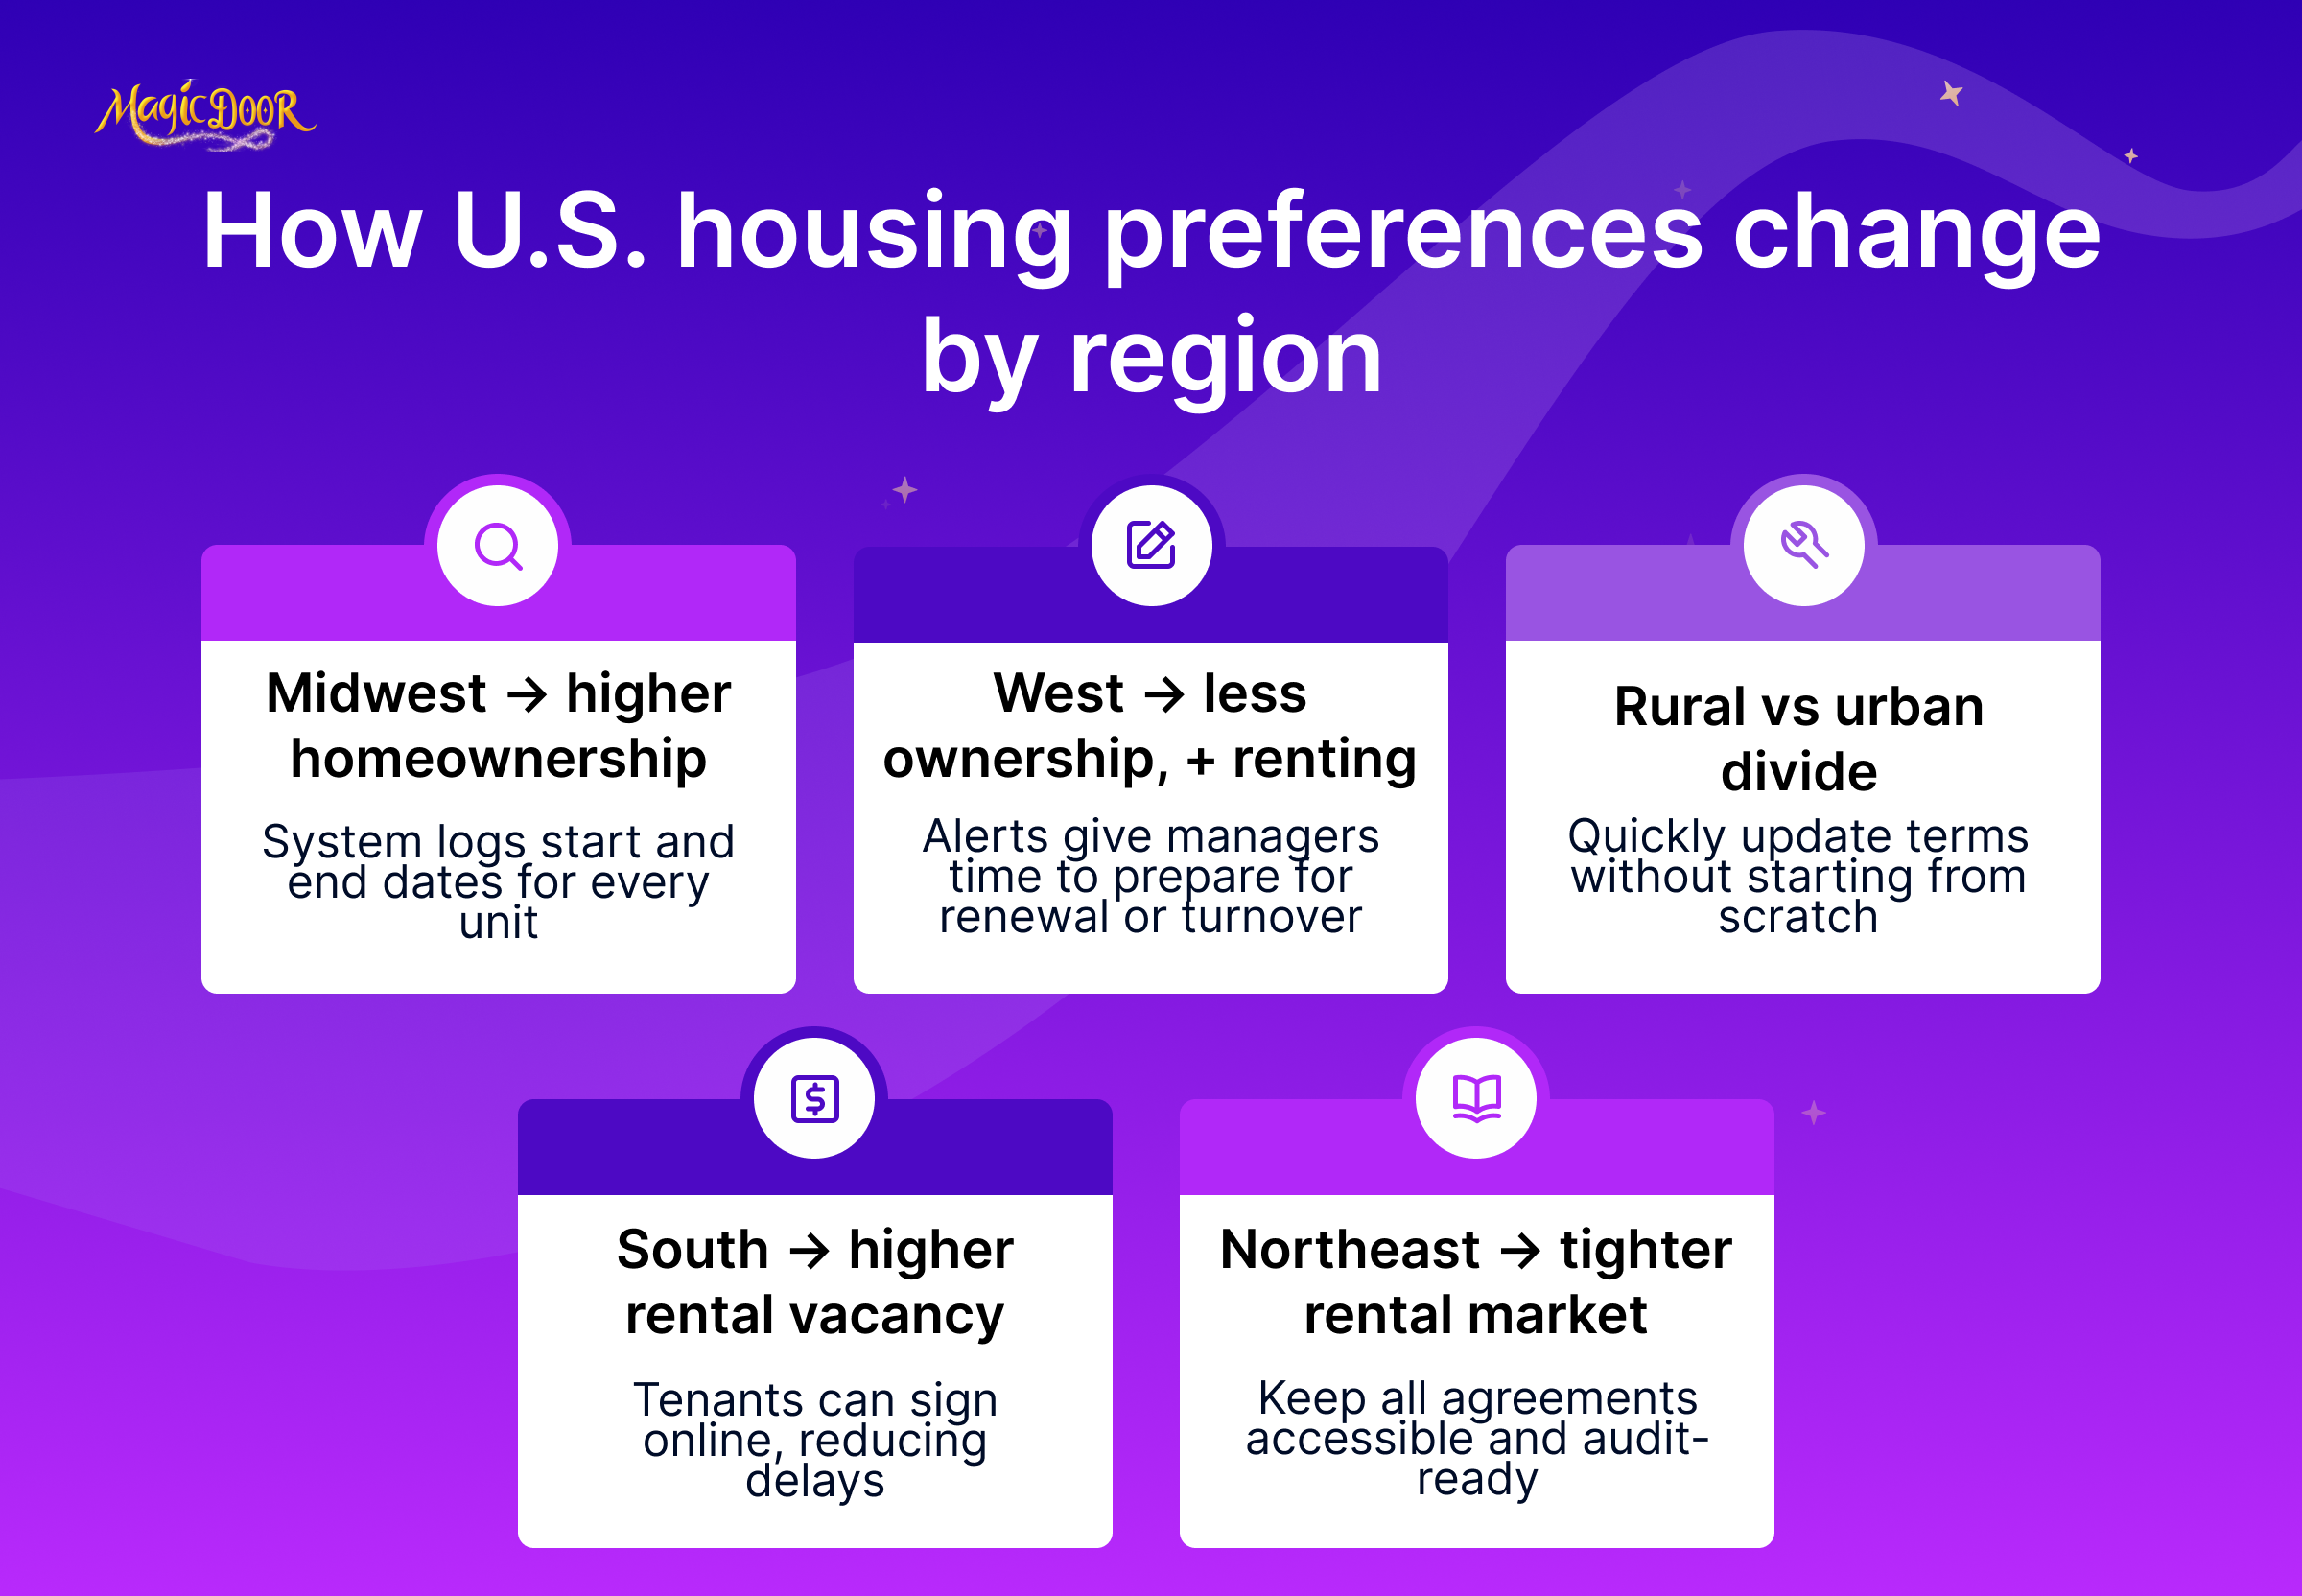
- The Midwest consistently reports the highest homeownership rates, with some states exceeding 70%. These areas benefit from more affordable housing and larger proportions of owner-occupied properties.
- On the other hand, the West sees the lowest ownership rates, influenced by elevated home prices and strong buyer demand that outpaces household income growth. California, for instance, often has a higher concentration of renting households due to its significant housing costs.
- Rural regions typically see more ownership than urban centers. Suburban areas also strongly prefer buying, especially among families seeking extra space and proximity to schools.
- Urban centers like New York and San Francisco show higher concentrations of renters. Limited housing units and opportunities for renting instead of purchasing attract younger age groups and professionals.
- States like West Virginia and Maine lead in owner-occupied housing, while New York and Rhode Island have the highest percentage of renters in the country.
Income disparities play a pivotal role in these trends.
The median household income in states with high homeownership often aligns with the cost of living, making purchasing more attainable. Conversely, in regions where housing prices outpace income growth, renting remains a more practical solution for many households nationwide.
Differences in the rental vacancy rate also illuminate these trends. The South often has higher vacancy rates, offering renters more options, while the Northeast experiences greater competition for available units.
These dynamics highlight how varied economic and cultural factors shape the housing choices of American households.
Homeownership by Age, Race, & Income Group in the U.S.
- The homeownership rate in the U.S. stands at 65.6%, marking a continued recovery since its historic low of 62.9% in 2016. However, it remains below the peak of 69% in 2004.
- Regional disparities persist. The Midwest has the highest homeownership rate, while states like California, New York, and Washington, D.C., experience much lower rates.
- Only 24% of all buyers were first-time homebuyers in 2024, down from 32% in 2023 and well below the historic high of 50% in 2010.
- Younger buyers are significantly impacted, with the average age of first-time homebuyers rising to 38—the highest on record.
- In 2024, 62% of homebuyers were married couples, while 20% were single women. Non-traditional households are becoming a growing segment of the market.
- Ethnic and racial disparities remain significant, with over 80% of homebuyers identifying as white, compared to far lower shares for other groups.
Cost of Homeownership in the U.S. (2025 Data)
- The average annual cost of homeownership, including maintenance, property taxes, and insurance, is $18,000, or around $1,500 per month.
- Home values are expected to rise by 3.7% in 2025, but affordability remains challenging. Mortgage rates hover above 6%, preventing many prospective buyers from entering the market.
- Approximately 86% of homeowners with mortgages have locked-in rates below 6%, creating resistance to selling in today’s higher-rate environment. This dynamic continues to constrain inventory.
Demographic Breakdown of Homeowners vs. Renters
Age & Generational Trends
Homeownership and renting decisions often vary based on generational differences, income, and life circumstances.
Understanding these trends offers insight into how age groups influence the real estate market.
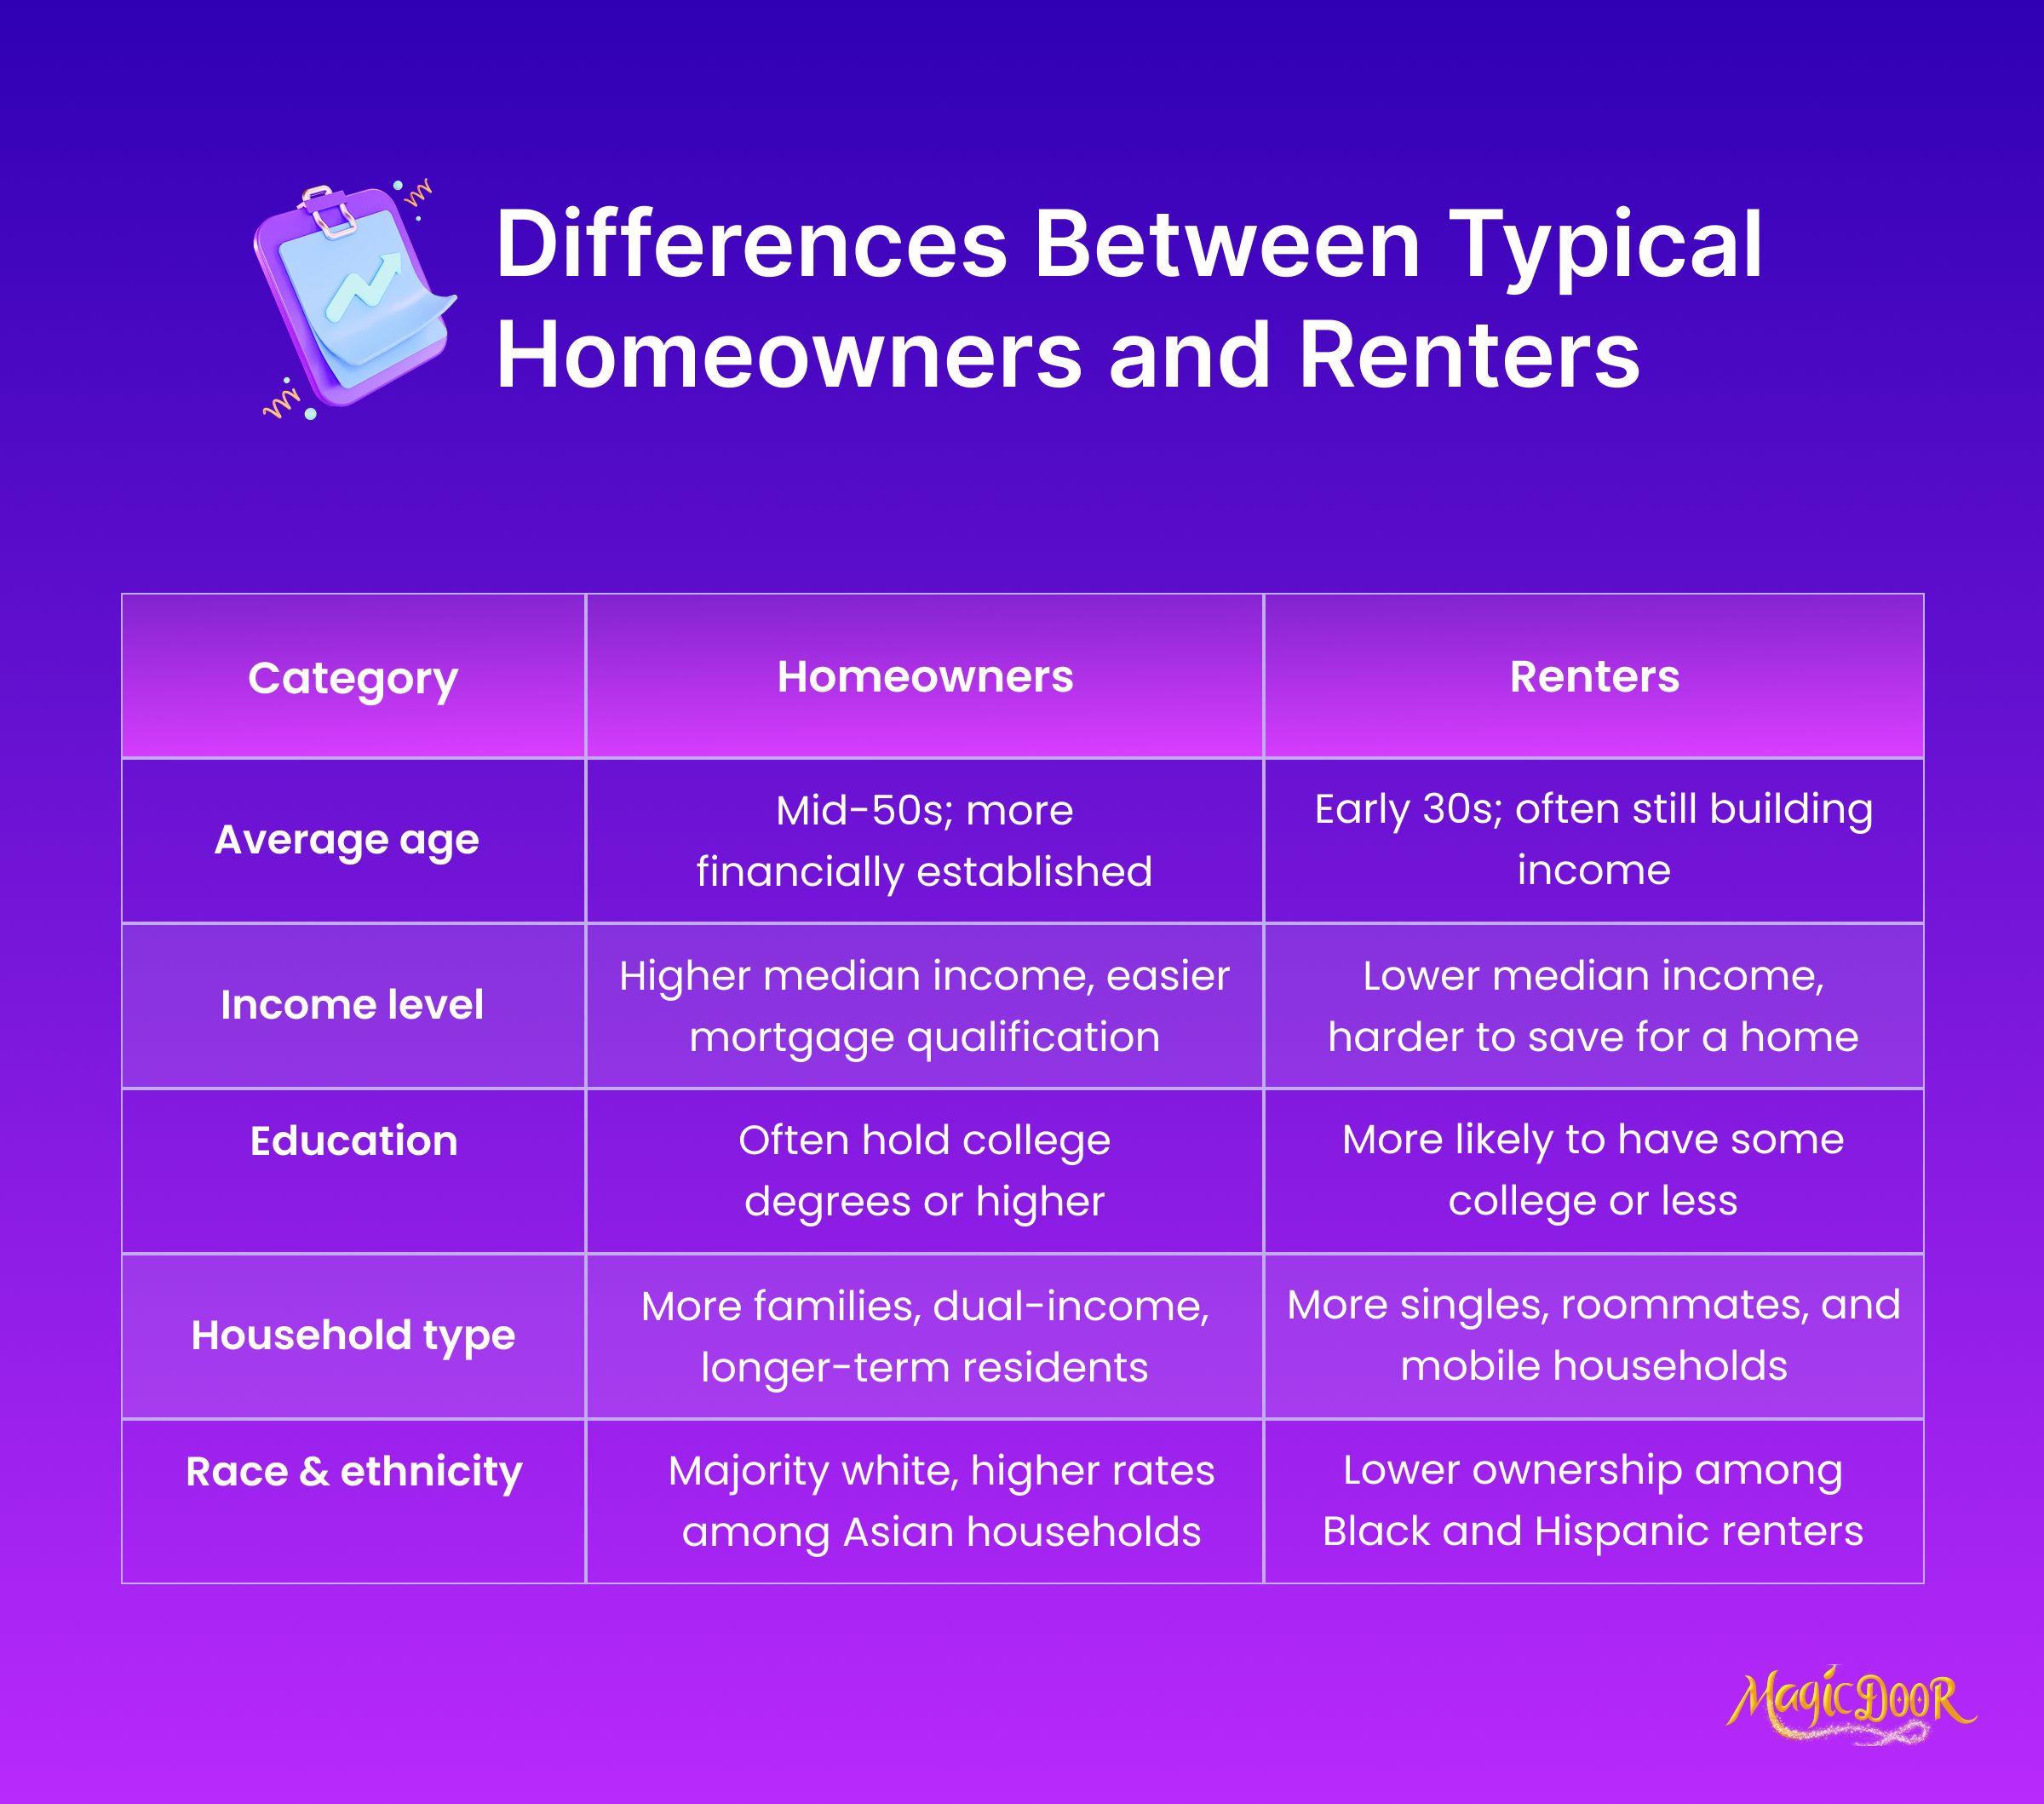
- The typical homeowner in the United States has a median age of 56, while renters tend to be younger, with a median age of around 31. This shows the time it takes for individuals to transition to homeownership, often driven by higher earnings, savings, or career progression.
- Over three-quarters (approximately 78%) of Baby Boomers own their homes. This generation, born between 1946 and 1964, often benefits from established careers, greater financial stability, and rising home values over recent decades. Many within this group have also paid off their mortgages, building significant home equity.
- Gen X represents people born between 1965 and 1980. Its homeownership rate is about 60%. However, this group has the heaviest mortgages, likely reflecting purchases made during peak home price periods. Many Gen X households are balancing mortgage payments with other responsibilities, such as tuition costs for their children.
- Millennials, born between 1981 and 1996, face more challenges in entering the housing market. Student loans, higher housing costs, and stagnant wages have delayed or limited their purchasing ability. Current studies reveal that roughly 38% of Millennials are homeowners, a number lower than earlier generations at the same age. Despite this, many Millennials aspire to buy homes and are increasingly entering the market as earning power improves.
- Generation Z, born after 1997, is the youngest demographic in the housing market. While only a small percentage currently own property, Gen Z is starting to invest in homeownership earlier than Millennials. Economic uncertainty and rising costs may pose obstacles, but this group shows a strong interest in building equity through real estate.
The demographic differences in homeownership reflect evolving economic realities and societal changes. Baby Boomers benefit from decades of appreciation in housing values, while younger generations, like Millennials and Gen Z, deal with a more challenging market.
Race & Ethnicity
Homeownership rates in the United States reveal significant racial and ethnic disparities.
Examining these differences provides a better understanding of the barriers and challenges faced by various communities in achieving homeownership.
- White households maintain the highest homeownership rates nationwide, averaging roughly 74%. This group often benefits from higher median incomes, more generational wealth, and better access to favorable credit terms, which improve purchasing power.
- Black Households face some of the lowest homeownership rates, hovering around 45%. Fewer opportunities for wealth-building contribute to this difference. Many renting households in this demographic cope with lower income levels and high rent payments, making it harder to save for down payments.
- Hispanic Households have a growing but relatively moderate homeownership rate, around 50%. Language barriers, limited access to credit, and rising housing costs pose obstacles for many within this group. However, recent trends show efforts to increase ownership opportunities, especially among younger age groups.
- Asian Households report higher-than-average rates of homeownership, at approximately 61%. While income within this group tends to be higher than the national average, barriers still exist, particularly for recent immigrants with limited credit histories. Geographic concentration in metropolitan areas with elevated home prices also impacts access to affordable housing options.
Disparities in homeownership rates across racial and ethnic groups highlight systemic issues affecting access to housing.
Addressing these gaps requires tailored approaches that improve equity in lending practices, expand affordable housing units, and empower historically underserved communities with additional resources.
Income, Education, & Other Influencing Factors
Who rents or buys a home depends heavily on financial strength, educational attainment, and the structure of their households.
Each variable plays a distinct role in shaping the trends in renter and homeowner statistics.
Income levels and housing decisions: Households with higher income levels are more likely to transition toward homeownership. Owning a home typically requires a stronger financial foundation to cover mortgage down payments, recurring costs, and unexpected housing expenses.
Low-income families remain renters due to barriers such as inadequate savings or inconsistent employment patterns. According to the latest data, the median household income for homeowners exceeds that of renters, highlighting the financial gap between the two groups.
Education levels and housing affordability: Research indicates that education directly intersects with homeownership. Higher levels of academic achievement correlate with greater earnings potential, enabling access to mortgages.
College graduates are more likely to own homes and tend to live in neighborhoods with higher median home values. Conversely, those with lower educational attainment often face credit challenges or budget constraints, leaving renting as their primary housing option.
Household types and preferences
The composition of a household can significantly sway the decision to rent or buy:
- Families favor long-term security and stability, making homeownership an attractive option. Larger housing units in suburban neighborhoods often cater to families looking for outdoor space and nearby schools.
- Single individuals are more likely to rent, particularly in urban areas with access to amenities, nightlife, and career opportunities. Renting provides flexibility, an essential factor for many pursuing career moves or lifestyle changes.
- Roommate arrangements are common among younger demographics, especially in cities. These arrangements allow individuals to share expenses in areas with high housing costs, making renting more financially feasible.
Financial Comparisons Between Homeowners & Renters
Median Income & Wealth Gaps
The financial contrast between homeowners and renters highlights significant gaps in income and wealth, revealing disparities driven by accessibility to homeownership and long-term financial planning.
Income differences:
Homeownership becomes more attainable for households with higher incomes. According to the latest data, the median income for homeowners surpasses $78,000 annually, while renters typically earn a median of approximately $42,000.
This stark difference underscores the challenges renting households face in saving for a down payment amidst rising housing costs and routine expenses. Additionally, higher credit scores among homeowners provide access to better mortgage rates, reducing long-term expenditures.
Wealth accumulation & net worth:
Homeowners, on average, possess significantly greater wealth than their renting counterparts. Research suggests that the median net worth of homeowners is estimated to exceed $250,000, while renters report a median net worth of less than $6,500.
This immense disparity exists because property ownership is a key driver of wealth accumulation. Through home equity appreciation and tax benefits, owning property allows households to create long-term financial security.
Renters, however, often lack the opportunity to build similar wealth, as monthly payments typically provide no return on investment.
Understanding these financial divides underscores the broader picture of housing inequality. Access to homeownership reflects an income advantage and creates opportunities for generational wealth building.
Housing Costs
The cost of housing is a central factor in deciding whether to rent or buy a home. Comparing monthly rent payments and mortgage costs reveals notable differences influencing these choices.
Monthly rent and mortgage payments:
Renters nationwide typically face monthly payments that vary based on location, size, and the availability of housing units.
Renters pay an average of about $1,300 per month. Mortgage payments, by comparison, average approximately $1,700 monthly, depending on home prices, mortgage interest rates, and property taxes.
While owning a home involves higher upfront costs, including a down payment, renting often requires a lower initial investment, typically covering security deposits and the first month’s rent.
Affordability and long-term costs:
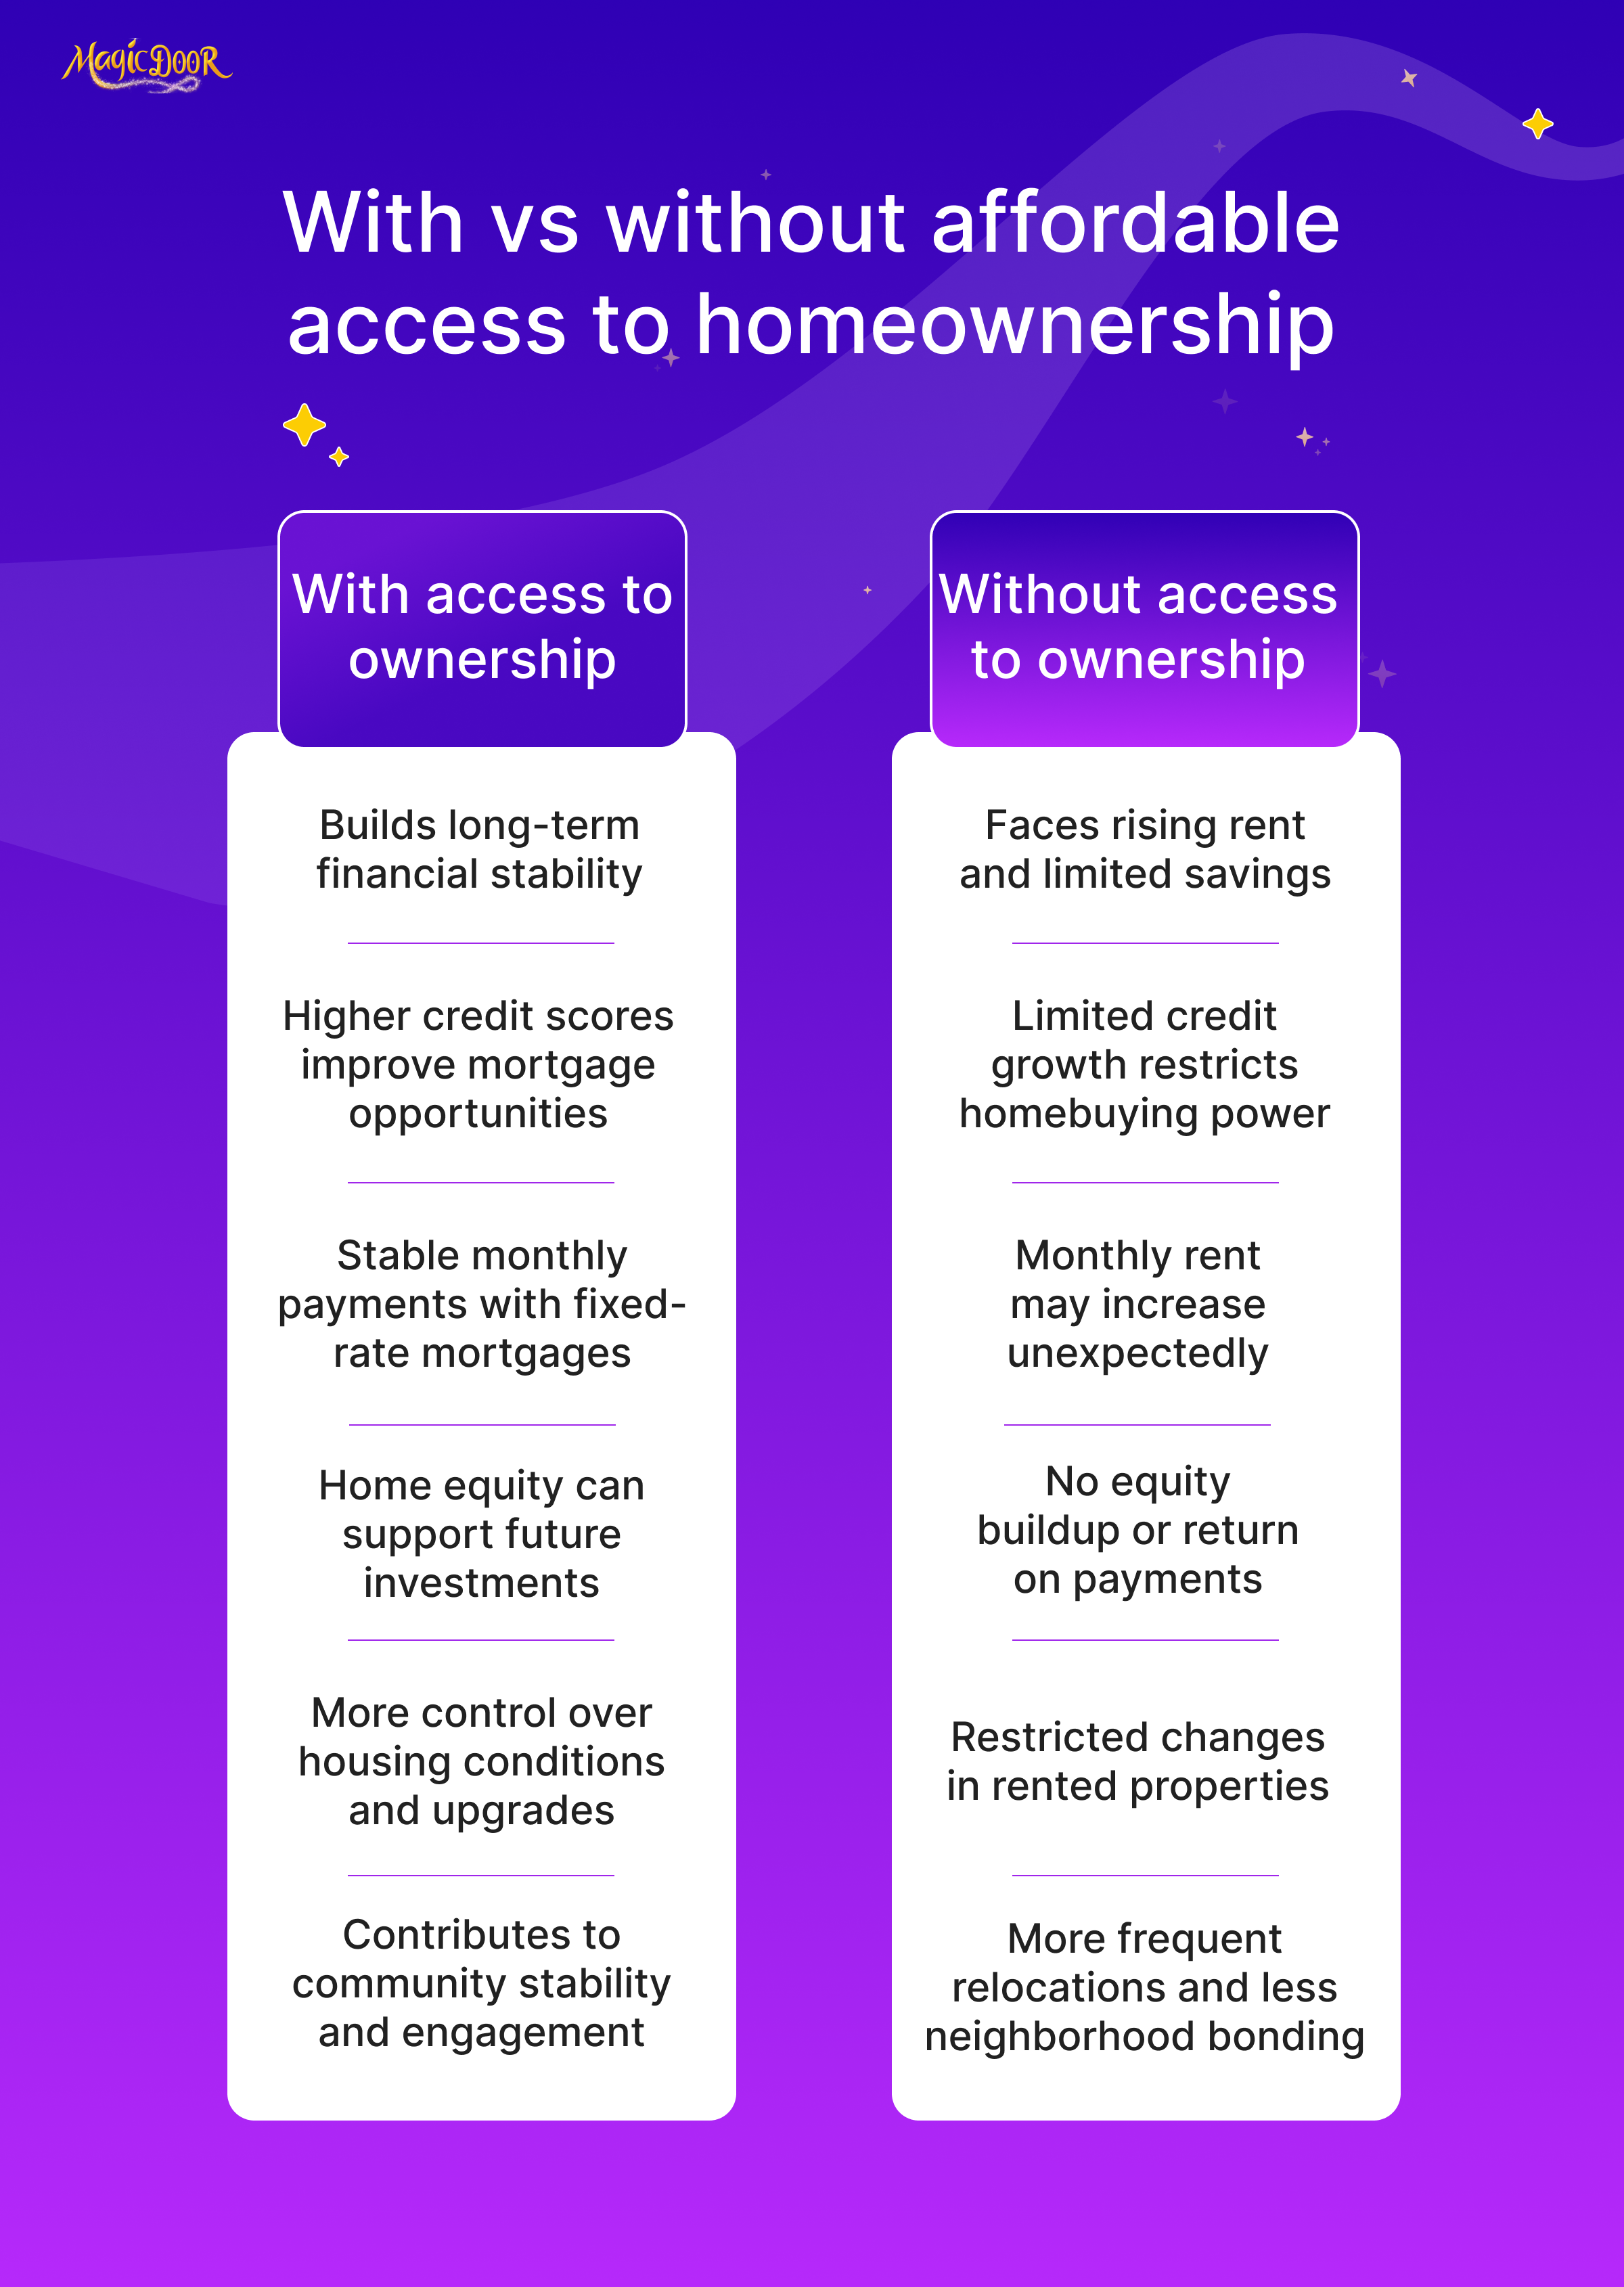
Renting offers flexibility, especially for those uncertain about staying in one place long-term. However, buying a home provides the opportunity to build equity over time.
Homeowners benefit from property appreciation and potential tax advantages, making renting a more rewarding choice in the long run for many. However, affordability remains a pressing concern for renters.
Rising rents, particularly in urban areas with competitive rental markets, often outpace increases in household income, putting financial strain on renting households.
Ultimately, the decision to rent or buy depends on individual financial situations and future goals.
Although monthly costs may be high in the short term, the potential benefits of ownership encourage many to view it as a solid long-term investment.
Insurance Costs & Coverage
Insurance is essential for both renters and homeowners regarding housing-related expenses. Understanding the differences in costs and coverage can help individuals make informed decisions about their housing options.
Average insurance costs
Homeowners insurance is typically more expensive than renters insurance due to broader coverage and higher liability limits.
On average, homeowners pay approximately $1,300 annually for their policies, while renters spend closer to $180 per year. This significant price gap reflects the risks and responsibilities of owning a home. Coverage for homeowners usually includes structural protection, contents, liability, and additional living expenses in the event of significant property damage.
Renters insurance, however, is limited to personal property and liability, excluding building structures.
Key differences in coverage include:
Homeowners Insurance
Policies for homeowners are more comprehensive, offering protection against damage from natural disasters, theft, or fire. Claims can address everything from structural repairs to replacing contents within the house.
Additionally, home equity is a critical consideration in coverage levels, as the property is a significant financial asset.
Renters Insurance
Designed to safeguard personal belongings, renters' insurance covers fewer risks compared to homeowners' policies. It typically includes personal liability protection and reimbursements for theft or damage to possessions within the rental unit.
However, it excludes structural repairs since that responsibility lies with the landlord.
The decision between homeowners' insurance and renters' policies is tied closely to housing situations and financial commitments. Renters enjoy lower upfront costs but must rely on robust landlord-provided structural protection.
Conversely, homeowners carry the burden of higher expenses, reflecting the risks tied to property ownership. Reviewing insurance options ensures sufficient coverage to manage potential claims and financial losses, providing peace of mind regardless of where you call home.
U.S. Rental Market Trends in 2025
- Roughly 34% of U.S. households rent, and this is driven by necessity (affordability issues) and choice (the flexibility of renting).
- Renting has become a long-term lifestyle for many younger adults, particularly Gen Z, who are delaying homeownership well into their 30s, opting to save or invest elsewhere.
- After a slowdown in recent years, rents are forecast to rise by 3–4% annually in 2025 and 2026. Single-family homes are likely to see higher rental increases than multifamily apartments.
- Even with these increases, median rents remain relatively stable, averaging $2,050 monthly in 2024.
- New rental units completed during the post-pandemic construction boom are helping to ease pressures in certain markets. However, a sharp drop in construction starts in 2024 signals a potential undersupply by 2026, which could escalate rent growth.
Housing Market Predictions for 2025
- An 11.7% increase in existing home inventory is projected, contributing to a slightly more balanced market. The months’ supply will rise to 4.1 months, up from 3.7 months in 2024.
- Housing starts for single-family homes are forecasted to grow by 13.8%, with around 1.1 million new homes expected to be built. However, longer lead times and zoning hurdles remain limiting factors.
- Existing home sales are expected to rebound slightly to 4.6 million, up from record lows of 4.09 million in 2023. Meanwhile, the newly built homes market is poised for growth as buyers increasingly turn to builders due to limited resale inventory.
- Home prices are expected to rise by 3.7%-4%, but the pace has moderated relative to the accelerated growth observed during pandemic-era surges.
U.S. Rental Vacancy Rates & Housing Availability
- The homeowner vacancy rate remains historically low at 1.0%, highlighting tight market conditions for resale properties.
- Rental vacancy was 6.6% in 2024, relatively stable compared to prior years. However, there were significant regional variations. For instance, rental vacancies exceeded 10% in Florida and South Carolina.
Impact on the Real Estate Market
- Home affordability pressures are changing both buyer and renter behaviors. High rates and rising costs lock buyers in place while incentivizing renting in specific markets.
- Pent-up demand for first-time homeownership is significant but remains constrained by wage stagnation and high borrowing rates.
- Markets like California, New York, and Florida are grappling with unique challenges, such as extreme housing costs or rising climate-related insurance premiums. Meanwhile, regions with lower demand are struggling to sell existing inventory.
- Once seen purely as a cost, renting is increasingly considered a strategic choice, offering mobility and financial flexibility to save or invest in turbulent markets.
Regional Analysis of the U.S. Housing Market in 2025
The Sun Belt
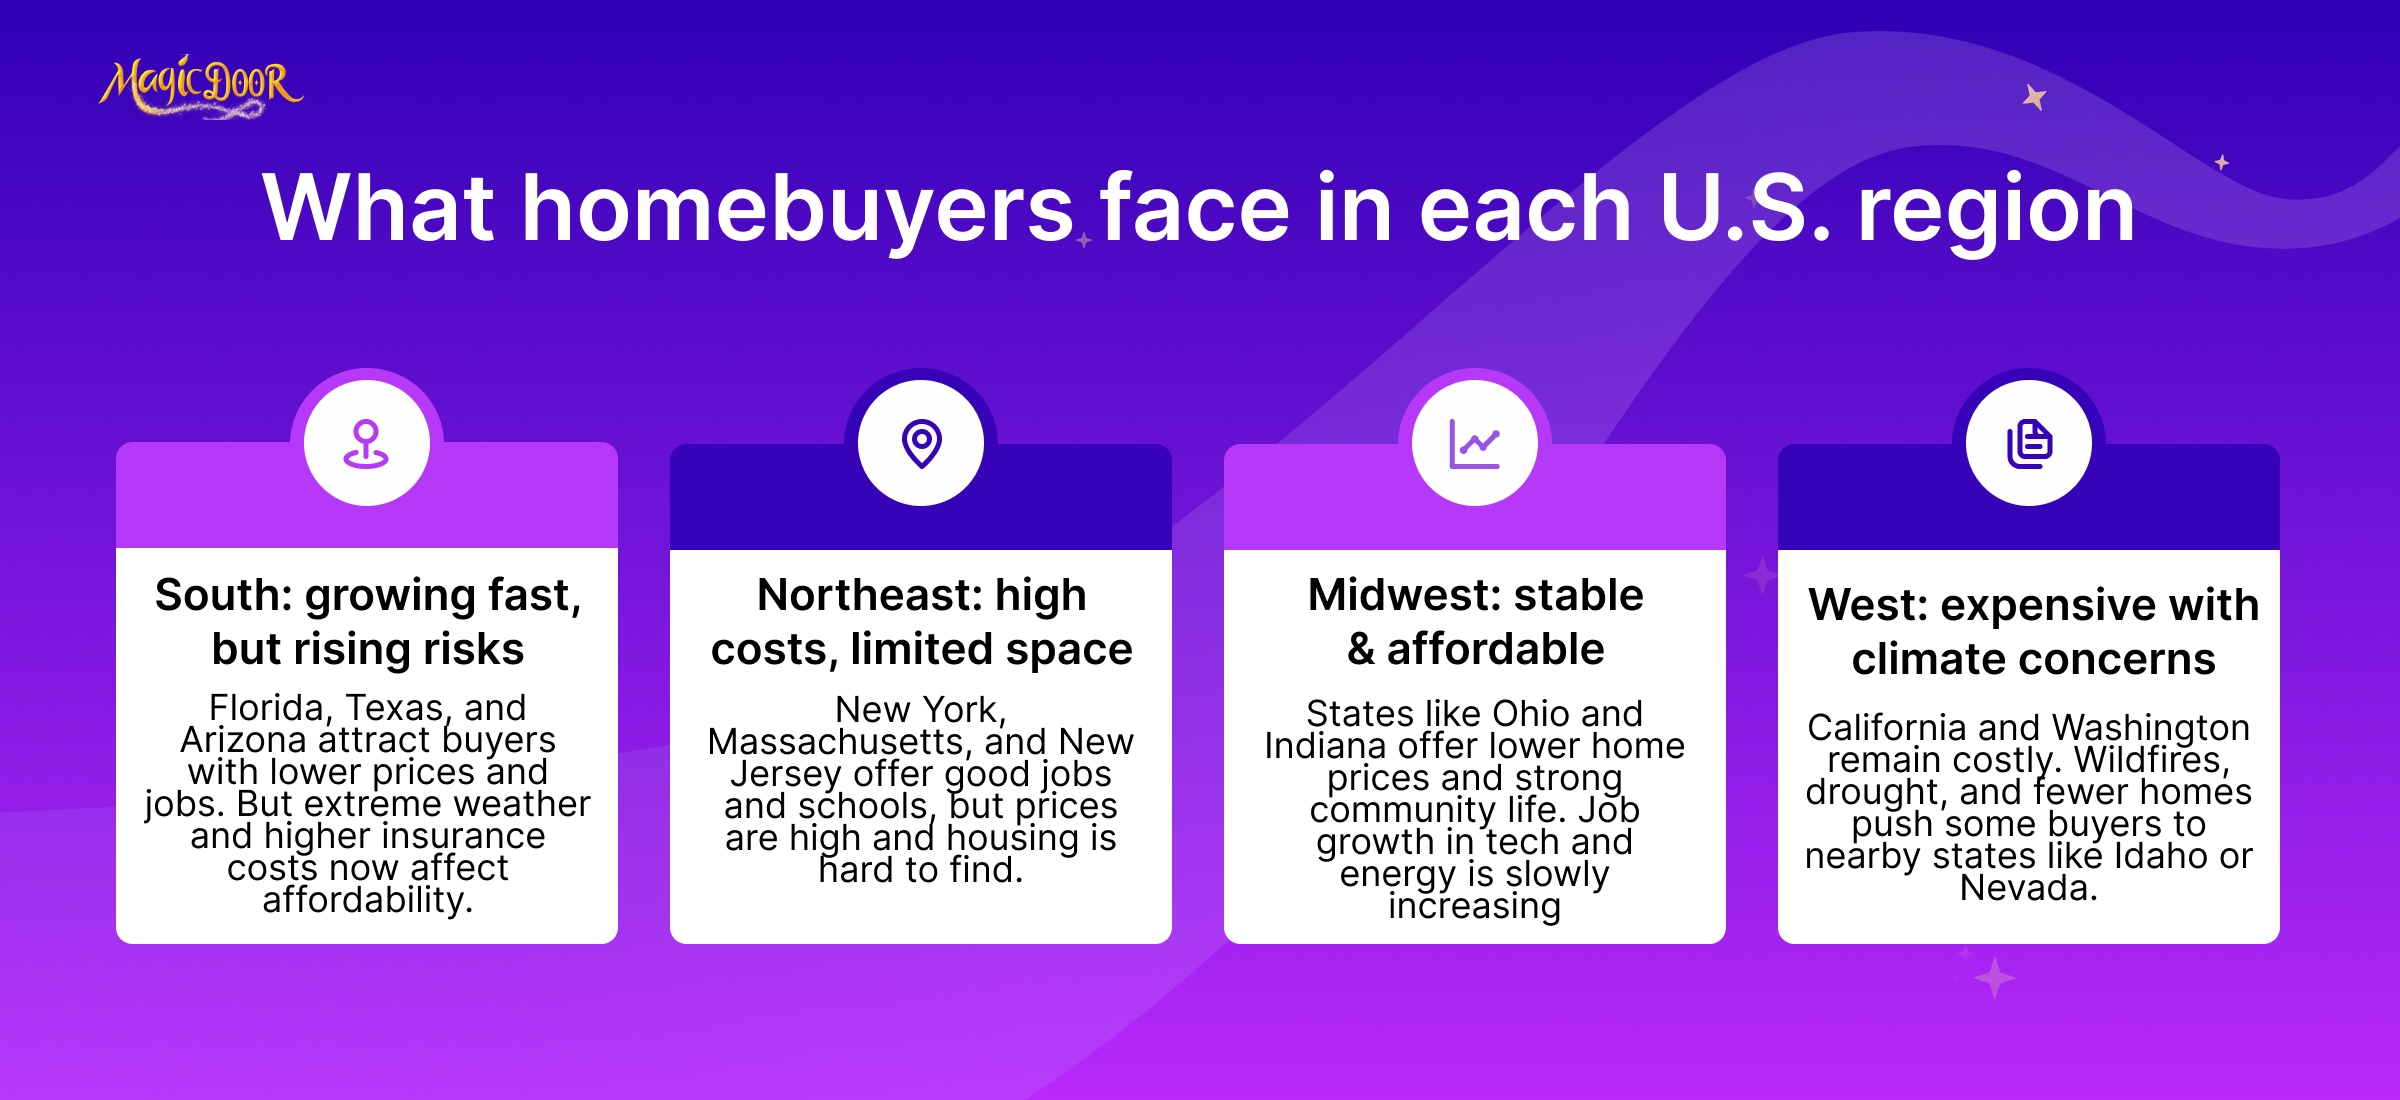
The Sun Belt continues to attract attention in 2025 due to its affordability, robust job market, and desirable lifestyle. States like Texas, Florida, and Arizona remain hotspots for migration, particularly for retirees and young professionals seeking warmer climates and lower taxes.
- Population growth: Cities like Austin, Phoenix, and Tampa are experiencing rapid population increases fueled by both domestic migration and international arrivals.
- Housing demand: High demand has driven up home prices and rents, albeit more moderately than the surge during the pandemic.
- Climate considerations: Increasing concerns about climate risks, such as hurricanes in Florida or rising temperatures in Arizona, have somewhat tempered enthusiasm. Rising insurance costs in states like Florida, where premiums surged by 45% in recent years, are a significant factor for potential buyers.
The ongoing development boom in the Sun Belt provides opportunities for buyers seeking new construction. However, prospective homeowners and renters should carefully consider climate-related risks and factor in insurance costs and potential property damage.
The Northeast
The Northeast remains one of the most expensive regions for housing, with states like New York, Massachusetts, and New Jersey continuing to grapple with affordability challenges.
- Urban revival: Following years of suburban migration, major metro areas like New York City and Boston are seeing renewed interest as employers implement hybrid work policies and cultural attractions that draw residents back.
- Limited inventory: The Northeast remains heavily supply-constrained due to strict zoning laws and limited new construction, particularly in dense urban areas.
- Rising costs: Renters and homebuyers face significant price pressures, as the Northeast has some of the country’s highest property taxes and energy costs.
While costs are high, the Northeast offers access to some of the nation’s best educational institutions, healthcare systems, and cultural amenities.
Buyers and renters looking for long-term stability should consider smaller cities or suburbs within commuting distance of major metropolitan areas. These areas often offer slightly lower costs and a better quality of life.
The Midwest
The Midwest, often called the nation’s most affordable housing market, continues to attract buyers for its cost-effectiveness and stable opportunities.
- Affordable living: States like Ohio, Indiana, and Michigan boast some of the highest homeownership rates in the country, with prices significantly below the national median.
- Job market diversification: Cities like Detroit and Columbus are evolving into hubs for technology and renewable energy industries, adding job opportunities that make the region more appealing to younger buyers.
- Rural and suburban growth: While urban areas like Chicago face challenges with population decline and affordability, rural and suburban areas are seeing increased interest.
The Midwest’s affordability and strong community association make it attractive to families and retirees seeking stability. However, buyers should note that rural areas may have slower appreciation rates, making them less ideal for short-term investments.
The West Coast
The West Coast remains a tale of two extremes, with sky-high home prices contrasted against pockets of affordability in smaller markets.
- Housing costs: Cities like San Francisco, Seattle, and Los Angeles are some of the most expensive markets in the nation, further strained by low inventory and restrictive zoning laws.
- Climate challenges: Wildfires, droughts, and rising sea levels continue to present significant risks, driving up insurance costs and complicating market conditions in areas like California.
- Migration patterns: Many residents are relocating to less costly areas within the region, such as Idaho or Nevada, or leaving the West Coast altogether.
Smaller cities such as Boise and Reno offer a balance of affordability and proximity to the amenities of larger West Coast metros. Before making long-term commitments, buyers should investigate regional risks, such as wildfire zones and water scarcity.
What It Means for Buyers and Renters
Each region presents unique considerations for homeownership and renting decisions in 2025.
Here are some key takeaways for navigating the market:
- Location priorities: Buyers and renters should weigh the importance of factors like job opportunities, climate risks, and access to amenities when choosing where to live.
- Regional costs: Consider not just purchase or rent prices but also additional costs like property taxes, insurance, and maintenance, which can vary significantly by region.
- Market timing: Regions facing inventory shortages may see competitive buying conditions, while areas with oversupply can present opportunities for renters or buyers looking for deals.
Conclusion
Homeownership rates continue to tell an important story about U.S. households.
Homeowners typically have higher scores, stronger savings, and larger equity positions, while many renters face barriers tied to income and credit. The data shows clear differences: the average credit score for homeowners sits well above that of most renters, and married couples still represent the largest percentage of owner-occupied housing units.
Renters' statistics also reveal challenges.
Over half of renters live in metro areas where costs outpace the national average, and despite growth in the first quarter and second quarter of recent years, affordability remains tight.
Looking across the previous year, the Census Bureau and Federal Reserve data clarify that home ownership remains a key driver of financial health. As the National Association continues tracking fourth-quarter and annual trends, households will need to weigh income, education, and credit carefully when deciding to rent or buy.
Frequently Asked Questions
What is the current homeownership rate in the US?
The homeownership rate in the US is approximately 65%, based on the latest housing statistics.
How do homeowner and renter demographics differ?
Homeowners tend to be older, with a median age of 56, while renters often fall into a younger age group, typically under 40. Household income is also higher among homeowners compared to renters.
Why is renting more affordable than buying in certain locations?
Renting can be cheaper in high property values, where mortgage payments, taxes, and maintenance costs exceed the average monthly rent.
How are rising mortgage rates impacting buyers?
Higher mortgage rates increase monthly payments, making it harder for buyers to afford homes, especially in a competitive market.
What are the typical costs associated with owning a home vs. renting?
Homeowners face expenses like mortgage payments, property taxes, insurance, and maintenance, while renters typically pay rent and potentially a few utilities, with fewer additional financial obligations.
What percentage of people are renters vs homeowners in the US?
According to census data, around 65% of households are homeowners, while roughly 35% are renters.
How many people own rental properties in the US?
Approximately 10 million individuals own rental properties, from single-unit homes to multi-family buildings.