Rising foreclosure filings have put pressure on homeowners and analysts alike. In 2025, changes in the housing market, interest rates, and loan delinquency patterns are once again drawing national attention to foreclosure trends.
This blog breaks down the latest foreclosure statistics, covering:
- Historical trends and recent activity
- State-by-state foreclosure rates
- Economic causes and borrower-level triggers
- Critical forecasts for 2025–2026
Whether you're a property investor, analyst, or simply trying to understand where things stand, this guide brings the most accurate and recent insights into one place. For international buyers dealing with U.S. market risks, this property management guide for foreign investors in the US is a good companion resource.
What is Foreclosure in The USA?
Foreclosure is the legal process lenders use to recover a property when a homeowner falls behind on mortgage payments.
It begins when the borrower defaults, and ends when the home is sold, either back to the bank, through an auction, or to a third party. This process varies slightly by state but follows a consistent structure nationwide.
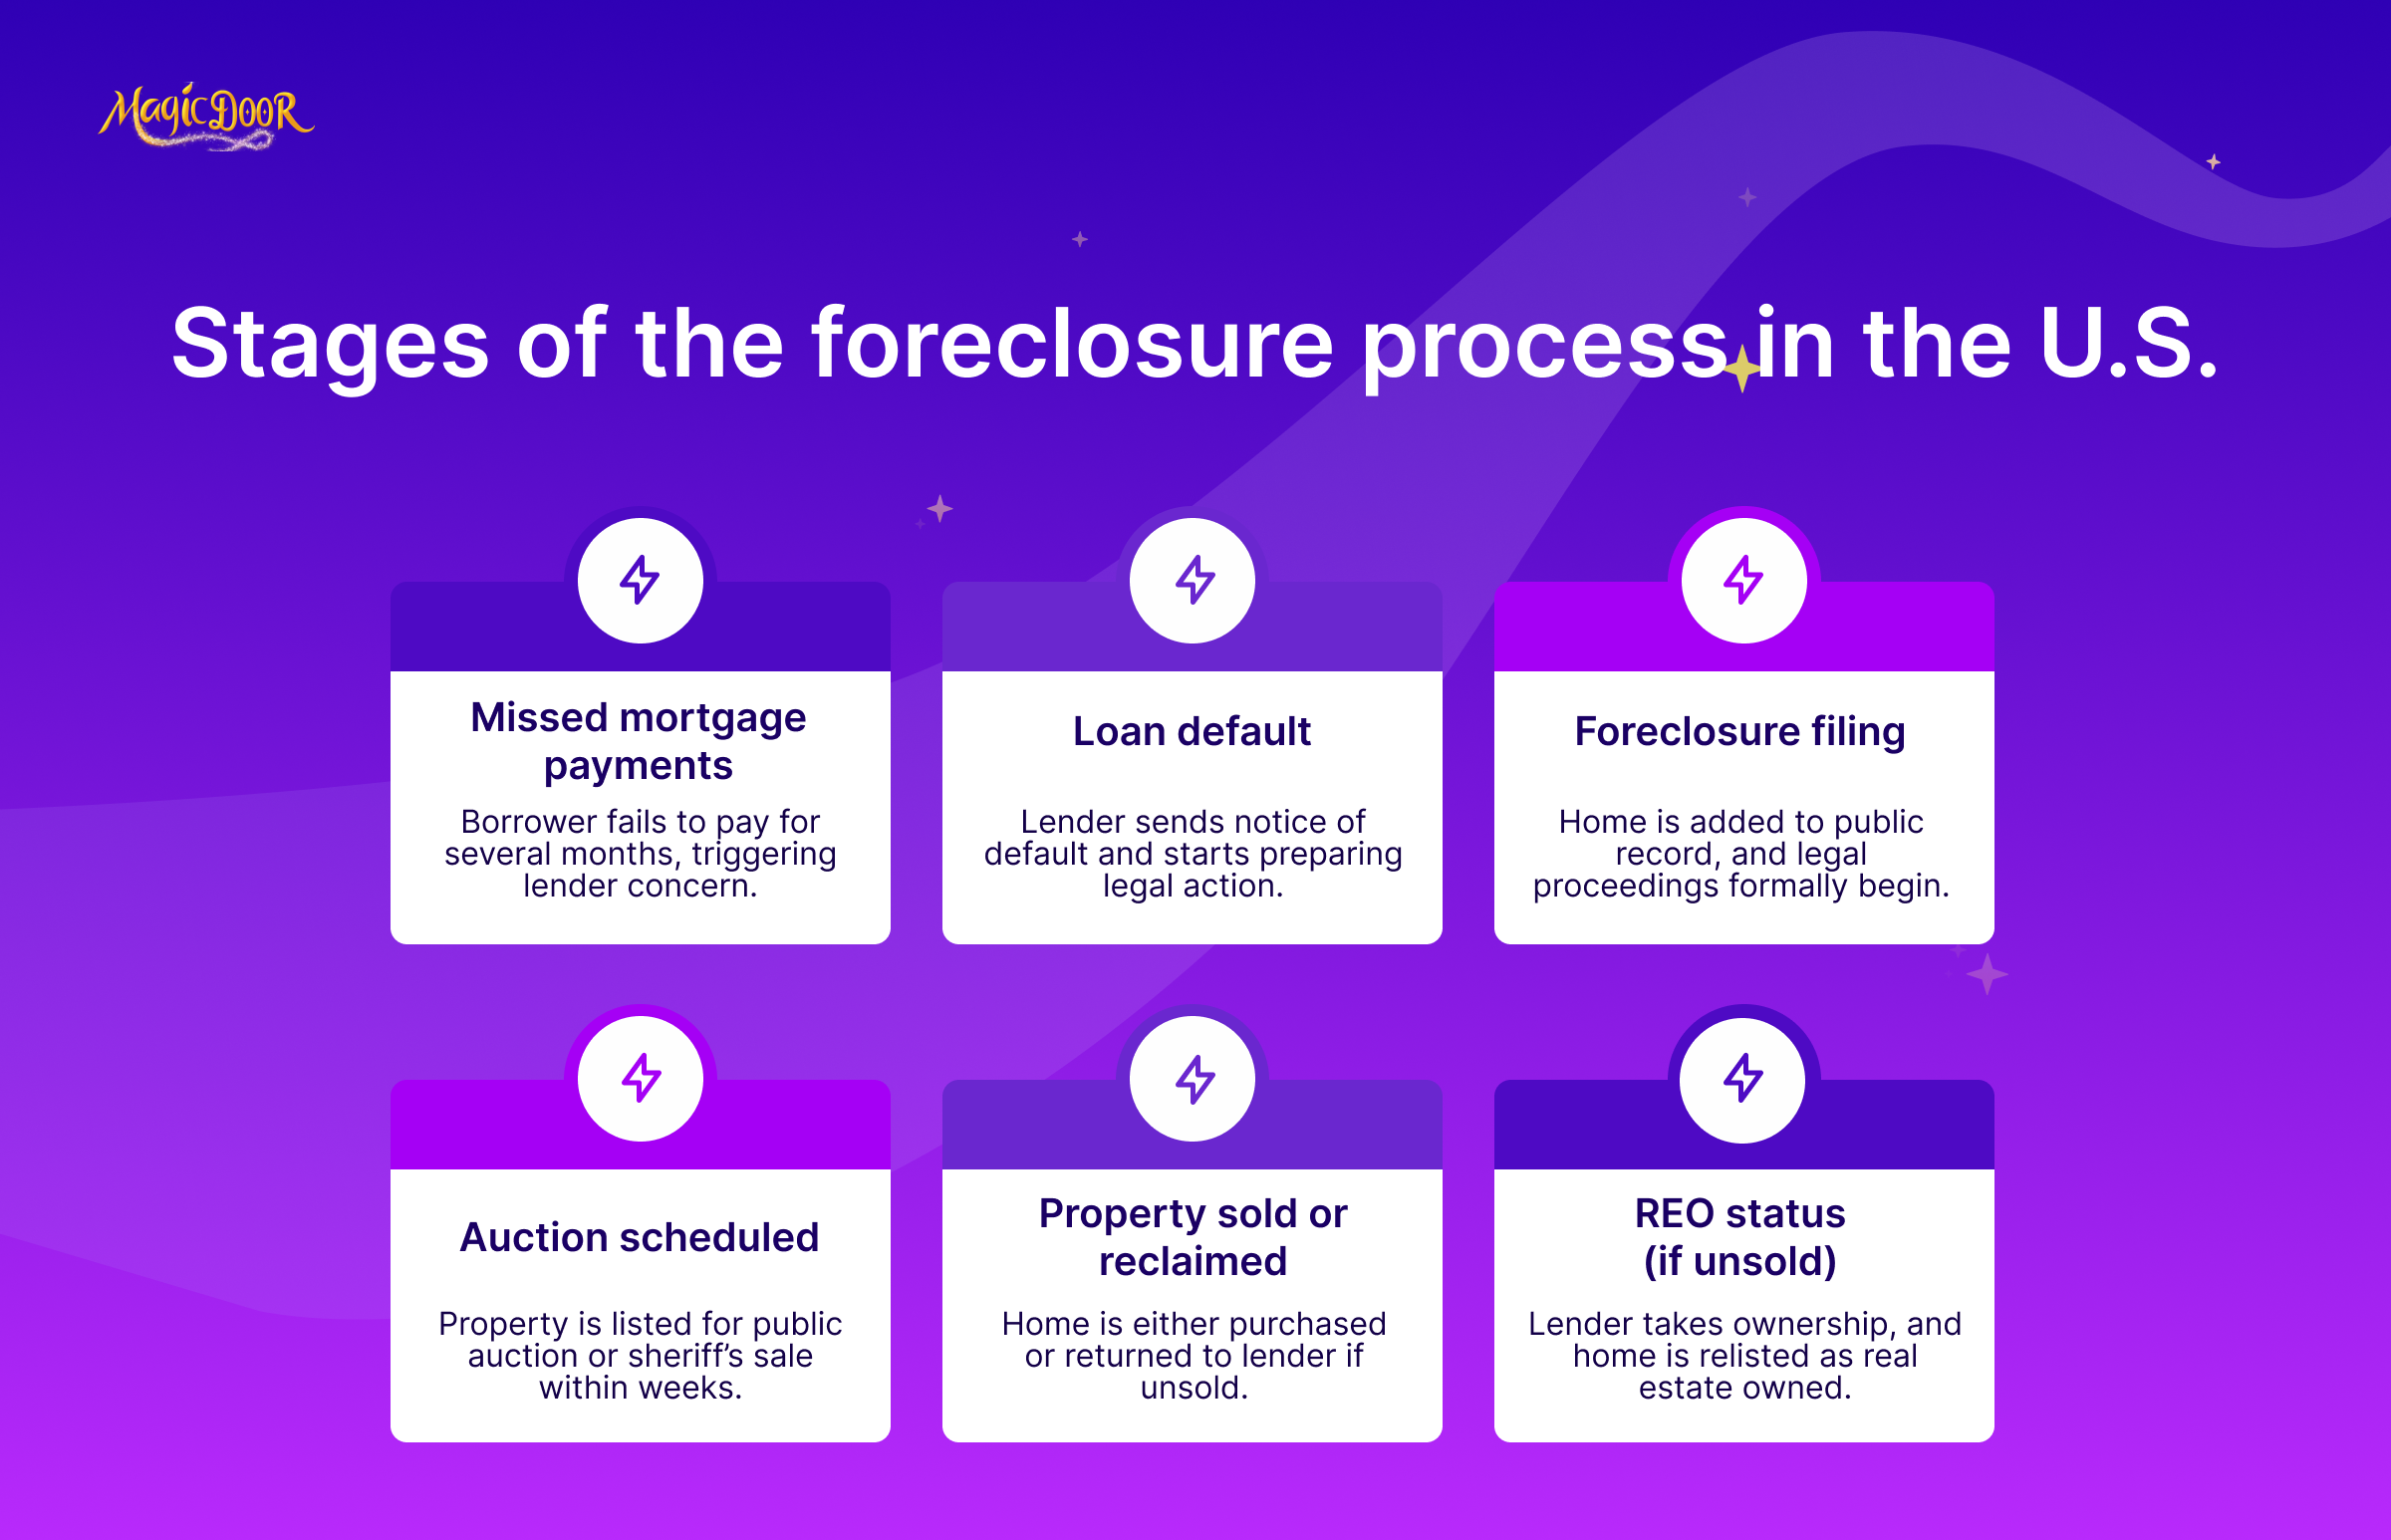
Once foreclosure filings begin, the property enters the public record. From there, it may go through several stages, including foreclosure starts, bank repossessions, and completed foreclosures. If the home isn’t sold at auction, it becomes a real estate owned (REO) property, meaning the lender now holds the title.
In places like California, Florida, and Illinois, state laws change how quickly the process moves. Some allow judicial review, while others are handled entirely by the lender.
Foreclosure impacts more than the borrower. It affects neighborhood values, regional housing markets, and broader market stability, particularly in counties with high foreclosure activity. Increases in default can signal changes in mortgage rates, changes in economic conditions, or local challenges affecting homebuyers.
While the foreclosure process is standardized in many ways, seasonal factors, local economies, and recent dynamics like unemployment or interest hikes can change how it plays out in a given market.
Overview of US Foreclosure Trends
Historical Foreclosure Rates in the US
Historically, the foreclosure rate in the U.S. has followed broader economic trends.
During the 2008 housing crash, foreclosure filings peaked at over 2.8 million in a single year.
Since then, filings declined steadily, until the pandemic pause distorted those numbers temporarily. This aligns with residential real estate statistics showing a temporary decline in delinquency before bouncing back in 2022–2023.
In 2019, just before the COVID-19 emergency protections, the U.S. recorded roughly 493,000 foreclosures, including real estate owned (REO) sales and completed foreclosures. Protections like forbearance and eviction moratoriums kept rates artificially low in 2020 and 2021.
Once protections expired, filings began to rise again, with 2022 seeing a 115% year-over-year increase.
That growth continued into 2023, driven by economic tightening, rising mortgage rates, and a cooldown in the housing market. In some regions, the backlog from paused activity also inflated counts.
Now, with recent dynamics like inflation, interest rate hikes, and declining affordability make buyer behavior, industry analysts, including Rob Barber, CEO of ATTOM, are watching closely to see how this might affect market stability going forward.
Key Foreclosure Statistics in 2024-2025
According to ATTOM’s Q2 2025 report, foreclosure filings, which include default notices, scheduled auctions, and bank repossessions, were reported on 95,349 U.S. properties in Q2 alone. That’s a 6% increase from the previous quarter and a 13% jump compared to Q2 2024.
The total number of foreclosure starts hit 55,172 in Q2 2025. That’s up 7% quarter-over-quarter and 15% year-over-year, suggesting lenders are becoming more aggressive in resuming activity.
Top 5 states by foreclosure rate (Q2 2025):
- New Jersey – 1 in every 800 housing units
- Delaware – 1 in every 845
- South Carolina – 1 in every 870
- Illinois – 1 in every 902
- Florida – 1 in every 998
Cities with the highest foreclosure rates include:
- Las Vegas, NV – up 23% year-over-year
- Chicago, IL – up 17%
- Orlando, FL – up 14%
- Cleveland, OH – up 13%
- Detroit, MI – up 12%
REO properties also increased, with 11,310 completed foreclosures reported in Q2 2025—a 9% rise from Q1. This signals that more properties are moving through the entire foreclosure process, ending in bank-owned sales.
While seasonal factors may affect short-term changes, the rise in foreclosure activity reflects broader market pressure from higher mortgage costs, reduced buyer pool confidence, and stricter loan servicing conditions.
State-by-State Foreclosure US Analysis
States with the Highest Foreclosure Rates
Foreclosure activity remains inconsistent across the country, with several states seeing notable spikes due to local economic pressures, judicial backlogs, and rising mortgage rates.
In Q2 2025, the foreclosure rate surged in areas where property values had increased quickly during the post-pandemic housing boom, only to cool in recent months. Many of these filings involve real estate owned (REO) properties, indicating lender repossession is on the growth again.
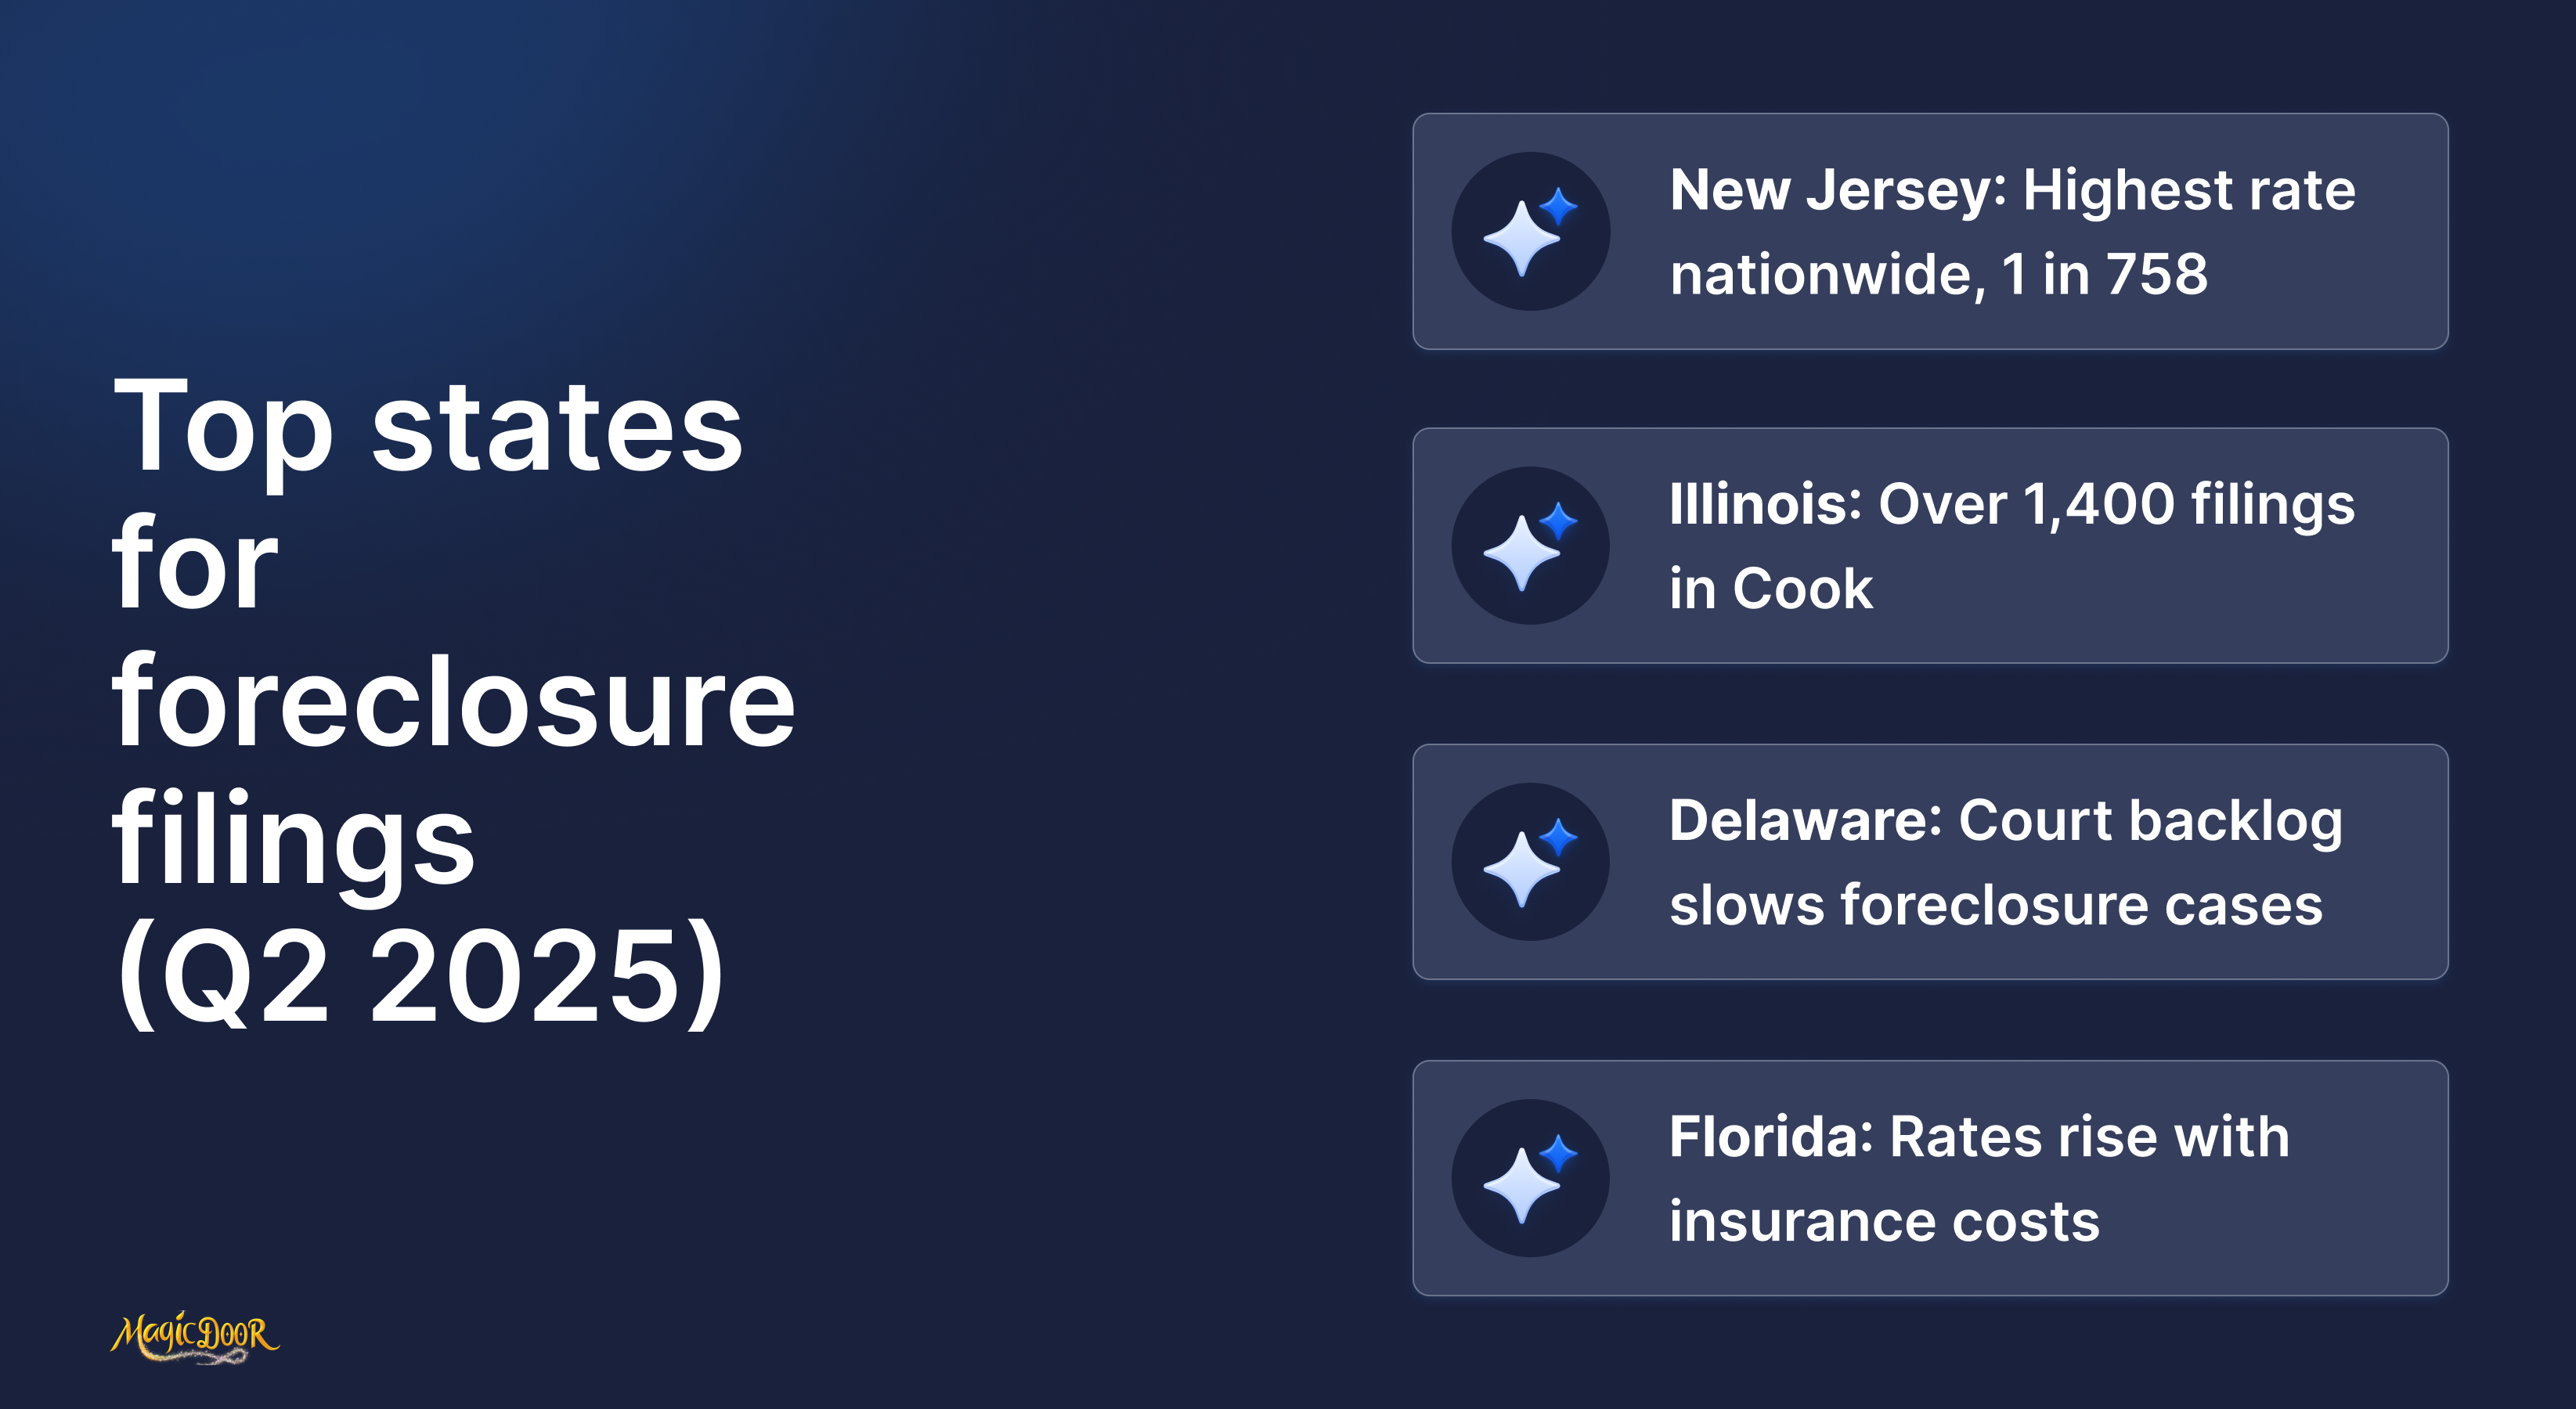
- New Jersey: 1 in every 758 housing units filed for foreclosure, highest rate nationwide.
- Illinois: 1 in 879 units, with Cook County alone reporting over 1,400 filings.
- Delaware: 1 in 902 units, driven by judicial foreclosure backlog.
- Connecticut: 1 in 972 units, foreclosure activity concentrated in Hartford and New Haven.
- Florida: 1 in 1,013 units, continued stress from increasing insurance premiums and mortgage rates.
- California: Over 2,000 filings in Los Angeles and Riverside counties, though statewide average remains lower.
ATTOM’s latest report suggests that these spikes may be temporary, but local property managers and real estate brokers are watching closely to understand how these changes could affect inventory and pricing by the end of the year.
These trends are also influencing the commercial real estate markets in the USA, where vacancies and refinancing pressure are compounding risks.
States with the Lowest Foreclosure Rates
Not all markets are under pressure. In fact, some states have maintained historically low foreclosure activity despite national fluctuations in mortgage rates and affordability.
These states typically feature stable housing markets, lower population density, and fewer speculative investments. As a result, lenders report fewer delinquencies, and courts see fewer foreclosure filings.
- South Dakota: Less than 1 in 8,000 homes, one of the lowest rates in the country.
- Vermont: Only 25 total foreclosure filings reported across the entire state.
- Montana: Recorded fewer than 50 filings, stable market with low borrower delinquency.
- West Virginia: Low activity due to minimal speculative real estate buying.
- North Dakota: Strong loan performance keeps foreclosure filings nearly flat.
These regions offer a different picture of the US housing market, with market stability tied more to conservative lending practices than external macroeconomic factors.
Many of these markets are dominated by detached homes, and single-family real estate statistics reveal lower foreclosure risk compared to multi-unit properties.
Seasonal Trends in Foreclosure Filings
Foreclosure filings in the United States follow clear seasonal rhythms.
These patterns shift based on tax deadlines, economic cycles, and the real estate market’s natural activity curve. Most foreclosure activity increases in the spring and early summer, dips in winter, and fluctuates with interest rate pressure and loan performance.
- In February 2025, foreclosure filings rose 5% month-over-month but dropped 1.7% from February 2024.
- October 2024 saw 30,784 filings, a 4% rise from September and 11% lower year-over-year, showing autumn’s stabilizing effect.
- May 2025 recorded a 1% monthly decrease, but filings remained 9% higher than May 2024, reflecting springtime acceleration.
- The first half of 2025 reported 187,659 filings, up 5.8% from H1 2024.
- Q2 2025 alone brought in 100,687 filings, a 7% jump from Q1, and 13% higher than Q2 2024.
- 21,007 completed foreclosures occurred in the first six months of 2025, rising 12% year-over-year.
Spring and early summer remain the most active periods for foreclosure starts, especially in states like California, Florida, and Texas.
For example:
- California recorded 2,915 foreclosure starts in October 2024.
- In May 2025, Texas (3,077), Florida (2,780), and California (2,641) led foreclosure initiations.
- Completed foreclosures rose to 3,844 in May 2025, a 7% monthly increase and 34% spike year-over-year.
This seasonal behavior emphasizes when properties are more likely to enter foreclosure, how market timing changes during the year, and how mortgage rates and foreclosure rates interact with borrower stress across regions.
State-Specific Foreclosure Rates
Notable Figures
Foreclosure filings in the first half of 2025 varied significantly by state, reflecting differences in housing market conditions, mortgage stress, and local economic factors:
- Illinois & Delaware: Tied at the top with a 0.23% foreclosure rate, meaning about 1 in every 435 housing units was affected .
- Nevada & Florida: Each at 0.21%, or approximately 1 in 475 units
- South Carolina: 0.20%, about 1 in 500 units .
Foreclosure starts also underscored a few key states:
- Texas led with 17,680 starts in H1 2025
- Next were Florida (15,198) and California (14,751)
In terms of real estate owned (REO) properties:
- Texas counted 2,207 REOs, followed by California (1,799), Pennsylvania (1,461), Illinois (1,439), and Michigan (1,260)
These figures show which state housing markets are currently facing the most foreclosure pressure, and where completed foreclosed property sales (REOs) add to existing market inventories.
Expectation for 2025-2026
Foreclosure trends are expected to stabilize through 2026, provided mortgage rates level off and employment remains stable.
- ATTOM projects filings will remain slightly above pre-pandemic levels due to recent price corrections and rising borrowing costs
- States with high rates earlier in 2025, like Illinois, Delaware, Nevada, and Florida, are likely to maintain elevated numbers, unless local economic conditions change greatly.
- Expect slower increases or small declines in states with historically low rates, such as South Dakota and Vermont, unless recent dynamics like job losses or insurance changes hit unexpectedly
All in all, most forecasts, supported by U.S. renter and homeowner statistics, predict a controlled increase in foreclosure starts and completed sales, without a widespread wave, unless major economic changes impact borrower stability in places already under pressure.
National Foreclosure Starts Decrease
In the first half of 2025, foreclosure starts in the U.S. declined noticeably compared to the previous year. According to ATTOM’s latest report, lenders initiated foreclosure on 138,979 properties, a 20% decrease from the same period in 2024.
This decline suggests a slowdown in early-stage foreclosure activity, even as foreclosure filings overall remain higher than pre-pandemic levels. Analysts point to stabilized mortgage rates, seasonal tax refunds, and temporary forbearance programs as factors helping more homeowners stay current.
Some additional insights:
- Foreclosure starts dropped 8% from Q1 to Q2 2025, showing improvement even within the half-year window.
- States like California, Texas, and Florida reported the largest volume of foreclosure initiations, but even those saw modest quarterly reductions.
- In Nevada, foreclosure starts dropped 22% quarter-over-quarter, one of the most significant shifts nationwide.
- Despite fewer new starts, completed foreclosures remain elevated due to backlog from 2023–2024.
Analysts are watching closely to see if this trend continues into the coming year, especially as seasonal trends and shifting mortgage rates could alter the pattern.
As more properties avoid joining the foreclosure pipeline, it may signal increasing market stability in a housing sector still reacting to recent economic fluctuations.
Causes of Foreclosures
Economic Factors Impacting Foreclosure Rates
Several macro‑level economic forces have driven recent foreclosure filings:
- Mortgage rates and loan stress: As fixed mortgage rates climbed above 7%, delinquency rates on FHA-backed loans increased to 3.53% in February 2025,up 19 basis points from last year. First‑time buyers showed higher default risk compared to prime borrowers.
- Rising insurance costs: Home‑insurance premiums increased by an average of 61% between 2022 and 2024. In states prone to severe weather, like Florida, South Carolina, and North Carolina, higher premiums correlate with rising foreclosures
- Economic stress signals: Legal inquiries about foreclosure hit a five‑year high in mid‑2025, even as filings remained below historical peaks.
- Regional hotspots: States with high foreclosure filings, Illinois, Delaware, Nevada, usually reflect concentrated economic weakness or greater sensitivity to national trends. In some regions, rent decreases during recessions become a real concern, destabilizing borrower income and increasing default risk.
These economic pressures affect all stages of the foreclosure process, from foreclosure starts to repossessions. As lenders encounter more distressed borrowers, filings grow, and completed foreclosures (REOs) increase accordingly.
Individual Triggers for Foreclosure
On a borrower level, several specific factors trigger foreclosure filings:
- Loan defaults: Most filings begin with a borrower missing payments. ATTOM reported 140,006 foreclosure starts in H1 2025, up 7% over the previous year.
- Strategic defaults: Some homeowners walk away voluntarily when property is underwater and they expect values won’t recover.
- Insurance failures: Flood victims like one Idaho homeowner faced repair costs that exceeded their home’s value, forcing bankruptcy or foreclosure.
- Benefit program expirations: The end of VA’s mortgage assistance (VASP) may elevate foreclosure risk among approximately 58,000 veterans.
- Assistance expiration: As pandemic-era mortgage support ended, foreclosure filings have resumed climbing, significantly in counties with limited government aid. This is particularly visible in vulnerable markets, where affordable housing real estate statistics correlate with higher foreclosure pressure.
Together, these economic and personal triggers explain why foreclosure activity remains elevated in 2025, under a surface that might appear stable if viewed only by headline numbers.
Predictions for 2025-2026 Foreclosure Rates
Foreclosure starts, which mark the initial legal action by lenders when homeowners miss payments, offer a key perspective on credit stress before foreclosures complete.
Understanding these trends can help predict changes in foreclosure activity and the more general housing market.
- 138,979 foreclosure starts occurred in the first half of 2025, a 20% decline from the same period last year.
- Between Q1 and Q2 2025, starts dropped 8%, despite filings remaining elevated.
- Nevada led the decline with a 22% quarter-over-quarter drop in foreclosure starts.
- Even with fewer new filings, completed foreclosures (REO) remain elevated due to a backlog, suggesting existing cases are still moving through the system.
This drop in foreclosure starts signals potential cooling in the foreclosure rate, even as pending cases keep REO figures high.
For real estate stakeholders and brokers, it means fewer new distressed listings may hit the market, while properties already in process move toward sale. Rising REO volumes also influence institutional buyers, us real estate investment trusts (REITs) statistics show changing appetite for distressed property acquisitions.
With the impact of mortgage rates stabilizing and recent dynamics like assistance programs easing, the trend suggests a cautious recovery.
However, if economic pressure returns, starts could rebound, so the situation remains worth monitoring into the coming year.
Potential Causes of Increased Foreclosures
Economic Pressures and Policy Shifts
A range of broader forces has intensified foreclosure activity in the U.S.:
- Rising mortgage rates: Homeowners with adjustable loans faced more sensitive monthly payments when the 30-year fixed rate climbed to ~6.72% in July 2025.
- Unemployment and wage stagnation: The FDIC reported slower job growth in 2024 and slight upticks in unemployment, reducing borrower resilience against missed payments.
- Higher insurance costs: Rising premiums for home and flood coverage in states like California and Florida are squeezing budgets, raising foreclosure risk.
- Climate-driven damage: First Street notes climate disasters could add $1.2 billion in mortgage losses in 2025, impacting around 19,000 properties.
- Less refinance options: FHFA data shows refinancing opportunities declined in early 2025 due to high rates, limiting homeowners' ability to lower payments.
Borrower-Level Triggers
Foreclosures often stem from specific borrower actions and challenges:
- Missed payments: ATTOM reported 138,979 foreclosure starts in H1 2025, a 20% drop year-over-year, but still reflecting vulnerable borrowers.
- Strategic defaults: Underwater mortgage holders may opt to walk away, particularly if home values decline.
- Easing assistance: As pandemic-era mortgage relief ended, foreclosure filings resumed climbing, particularly in counties without strong government support.
- Zombie properties: ATTOM identified 7,094 abandoned homes in Q1 2025, a subset of foreclosure cases lingering through the process.
Conclusion
Foreclosures are a key signal for market stability, and in 2025, that signal is mixed.
While some regions are seeing fewer foreclosure starts, others are under pressure due to higher mortgage rates, climate risk, and post-pandemic financial strain.
Understanding the causes behind these numbers, from increasing housing costs to policy gaps, helps clarify what may lie ahead. As national data continues to shift quarter by quarter, staying informed with reliable, state-level insights will be essential for homeowners, lenders, and anyone tracking the pulse of the U.S. real estate industry.
Frequently Asked Questions
What is the current foreclosure rate in the US?
The foreclosure rate 2024 was 0.23% of all housing units, representing 322,103 properties with foreclosure filings.
How many foreclosures in the US in 2025?
Although data for 2025 is not yet fully available, trends suggest that foreclosure activity will remain similar to 2024 levels.
What state has the highest rate of foreclosure?
Florida and New Jersey tied for the highest foreclosure rate in 2024, with one in every 267 housing units.
When did foreclosure rates peak in the United States?
Foreclosure rates peaked 2010 during the mortgage crisis, with nearly 2.9 million properties affected.
What city has the highest foreclosure rate?
Lakeland, Florida, had the highest foreclosure rate in 2024, with one in every 172 housing units.