
The real estate market for single-family homes in 2025 shows signs of recovery while facing some challenges.
Here’s an overview of the key statistics for housing starts, home prices, and inventory, presented simply to give you a clear understanding of what’s happening.
What is Single-Family Real Estate and Why Does It Matter?
A single-family home is a stand-alone residence intended for one household.
Unlike apartments or other shared housing types, it occupies its plot of land and functions independently regarding utilities and access. Such homes offer unique benefits, making them a significant focus in the housing market and family living.
Single-family properties are essential for understanding housing market trends.
Statistics like the median sale price or typical property taxes offer insight into real estate conditions. For example, when the median price increases or inventory drops, it can reflect market shifts that affect buyers and sellers.
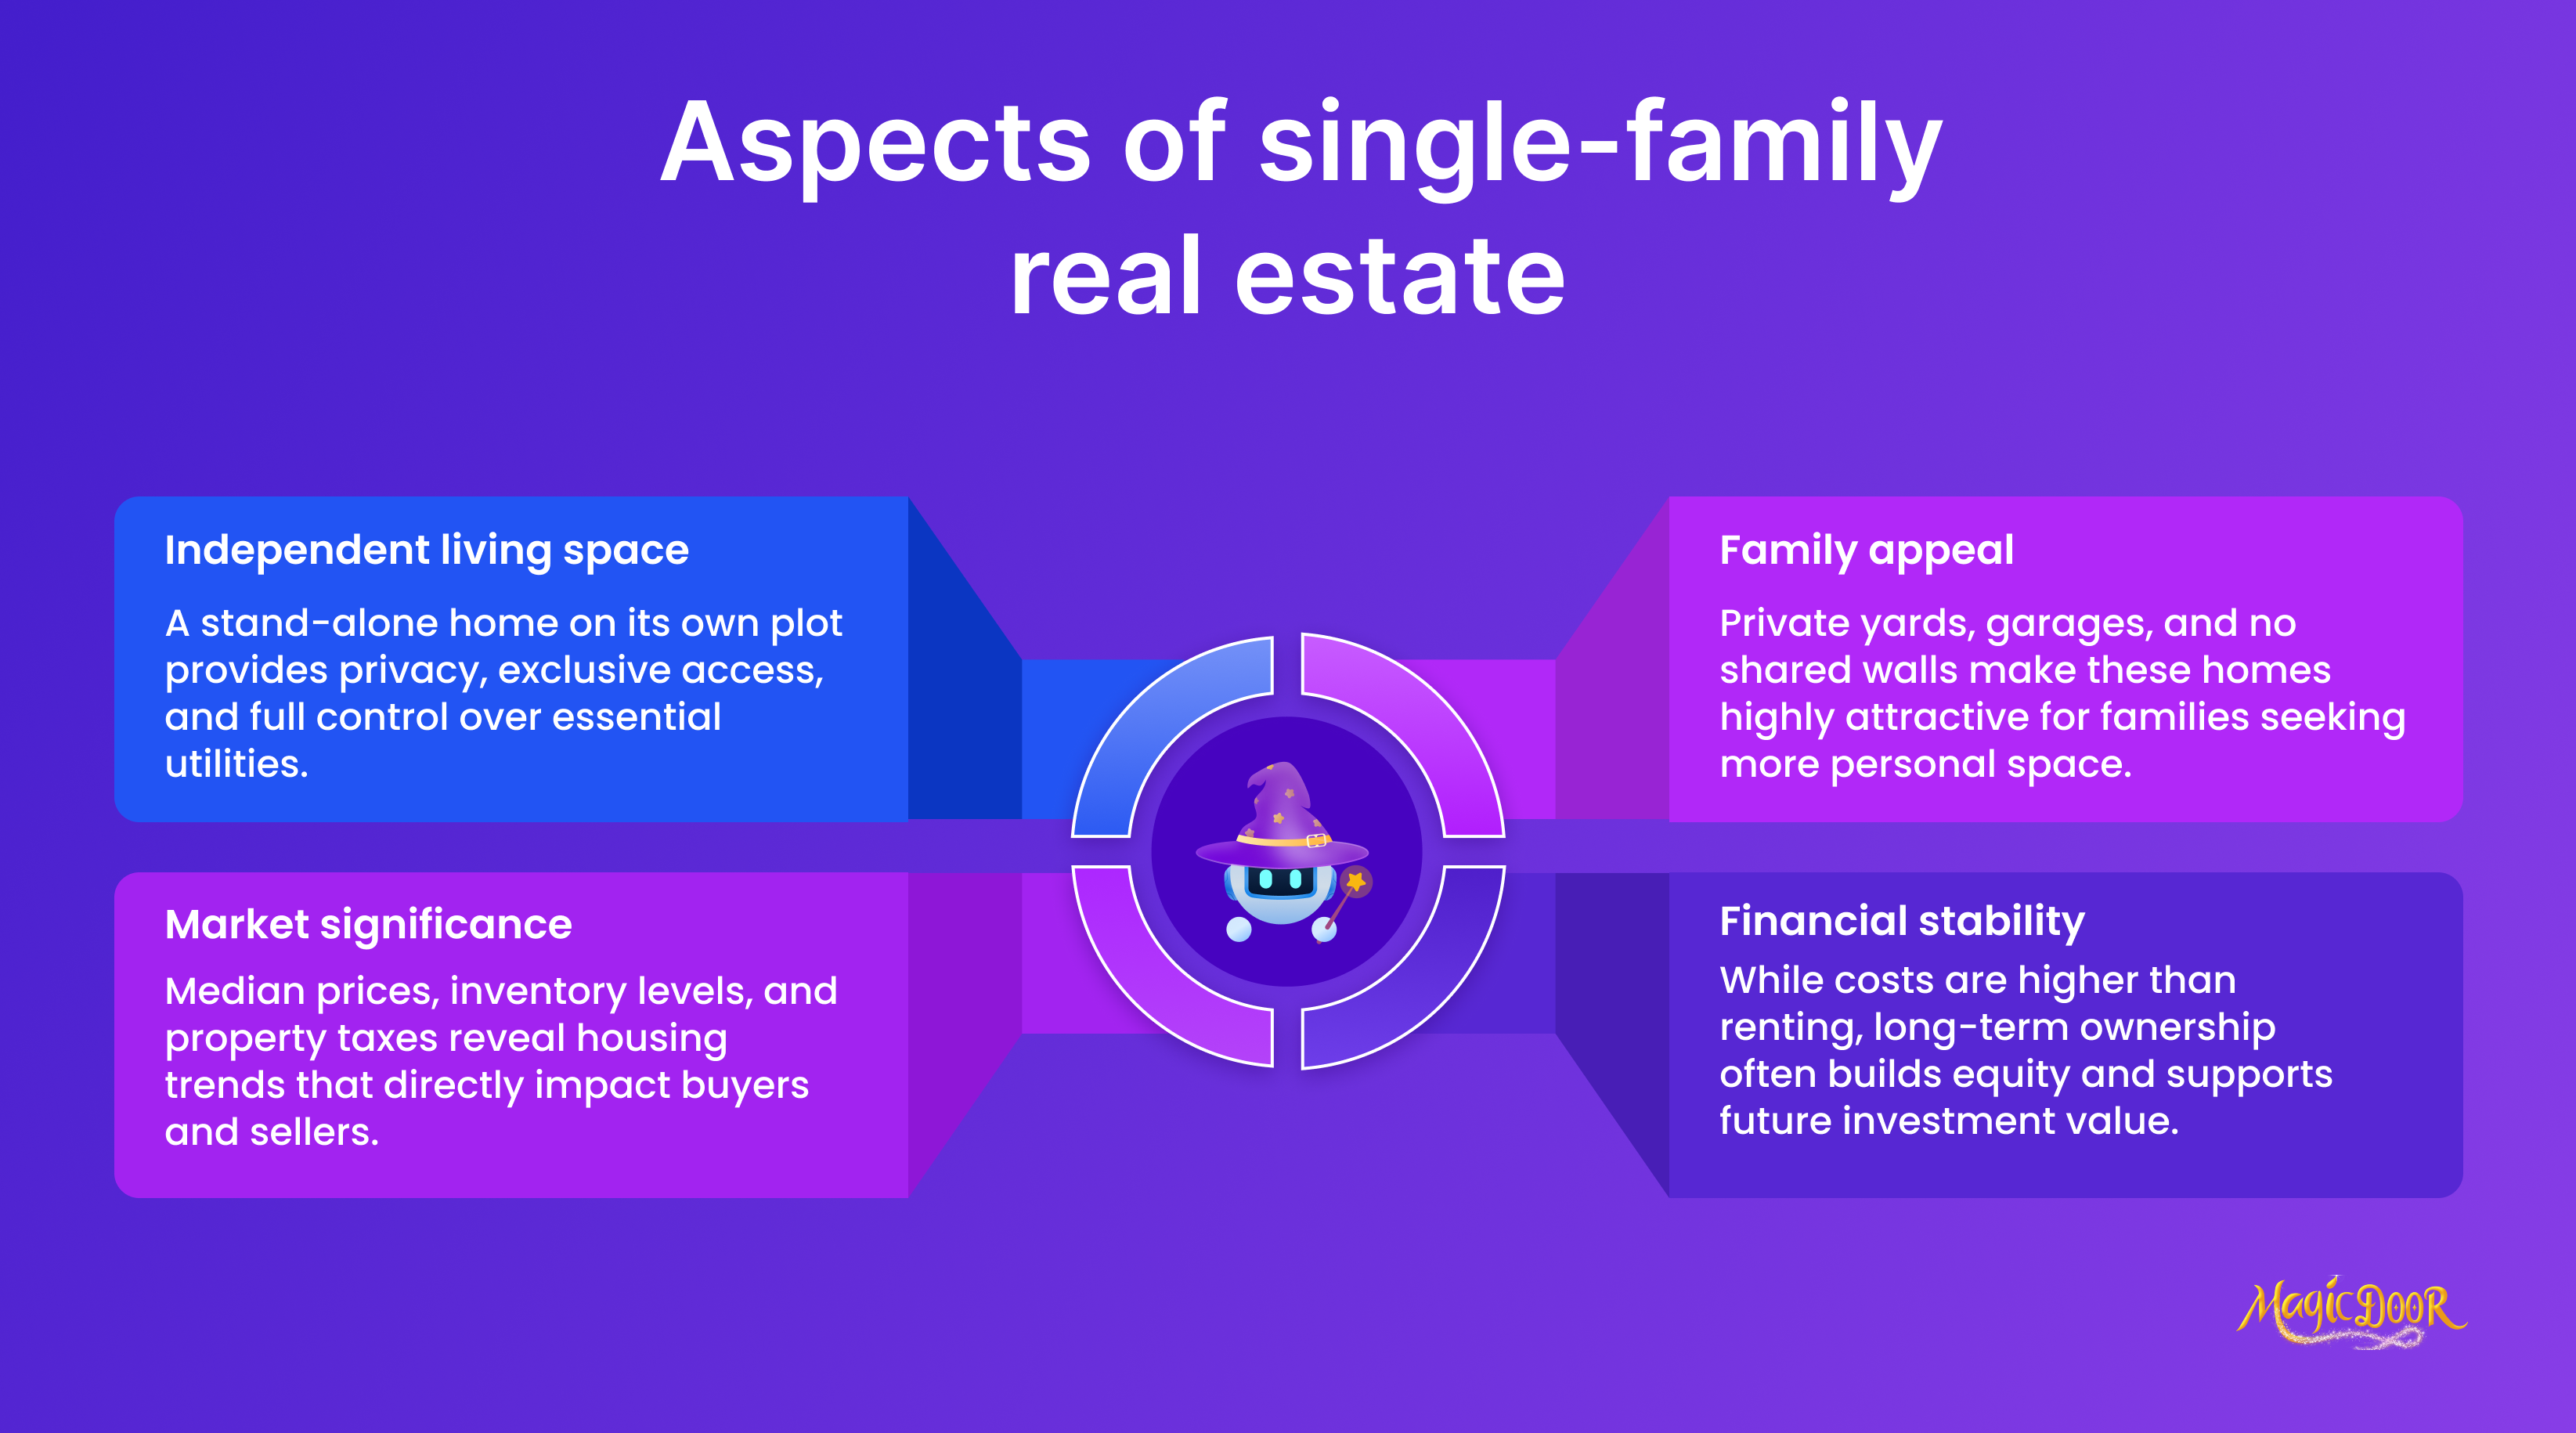
This type of housing appeals to families and individuals seeking privacy and more interior and exterior space. It typically includes private yards and garages and no shared walls or facilities. This translates to better overall environmental control and greater opportunities for personal customization.
From a financial perspective, owning such a property provides stability but comes with responsibilities.
Costs include property taxes, maintenance, and utilities, which often make owning more expensive than renting. However, the enduring value of single-family homes allows owners to potentially benefit from equity growth over time, making them an attractive investment for future planning.
Single-Family Housing Stats
Recent Market Developments & Patterns
- Construction trends: Builders feel more confident as more straightforward regulations make construction faster.
- Economic indicator: Housing starts remain a key marker of economic recovery, signaling increased investment in residential construction.
- The median size of new single-family homes in the U.S. has held steady, offering homebuyers consistent layout options.
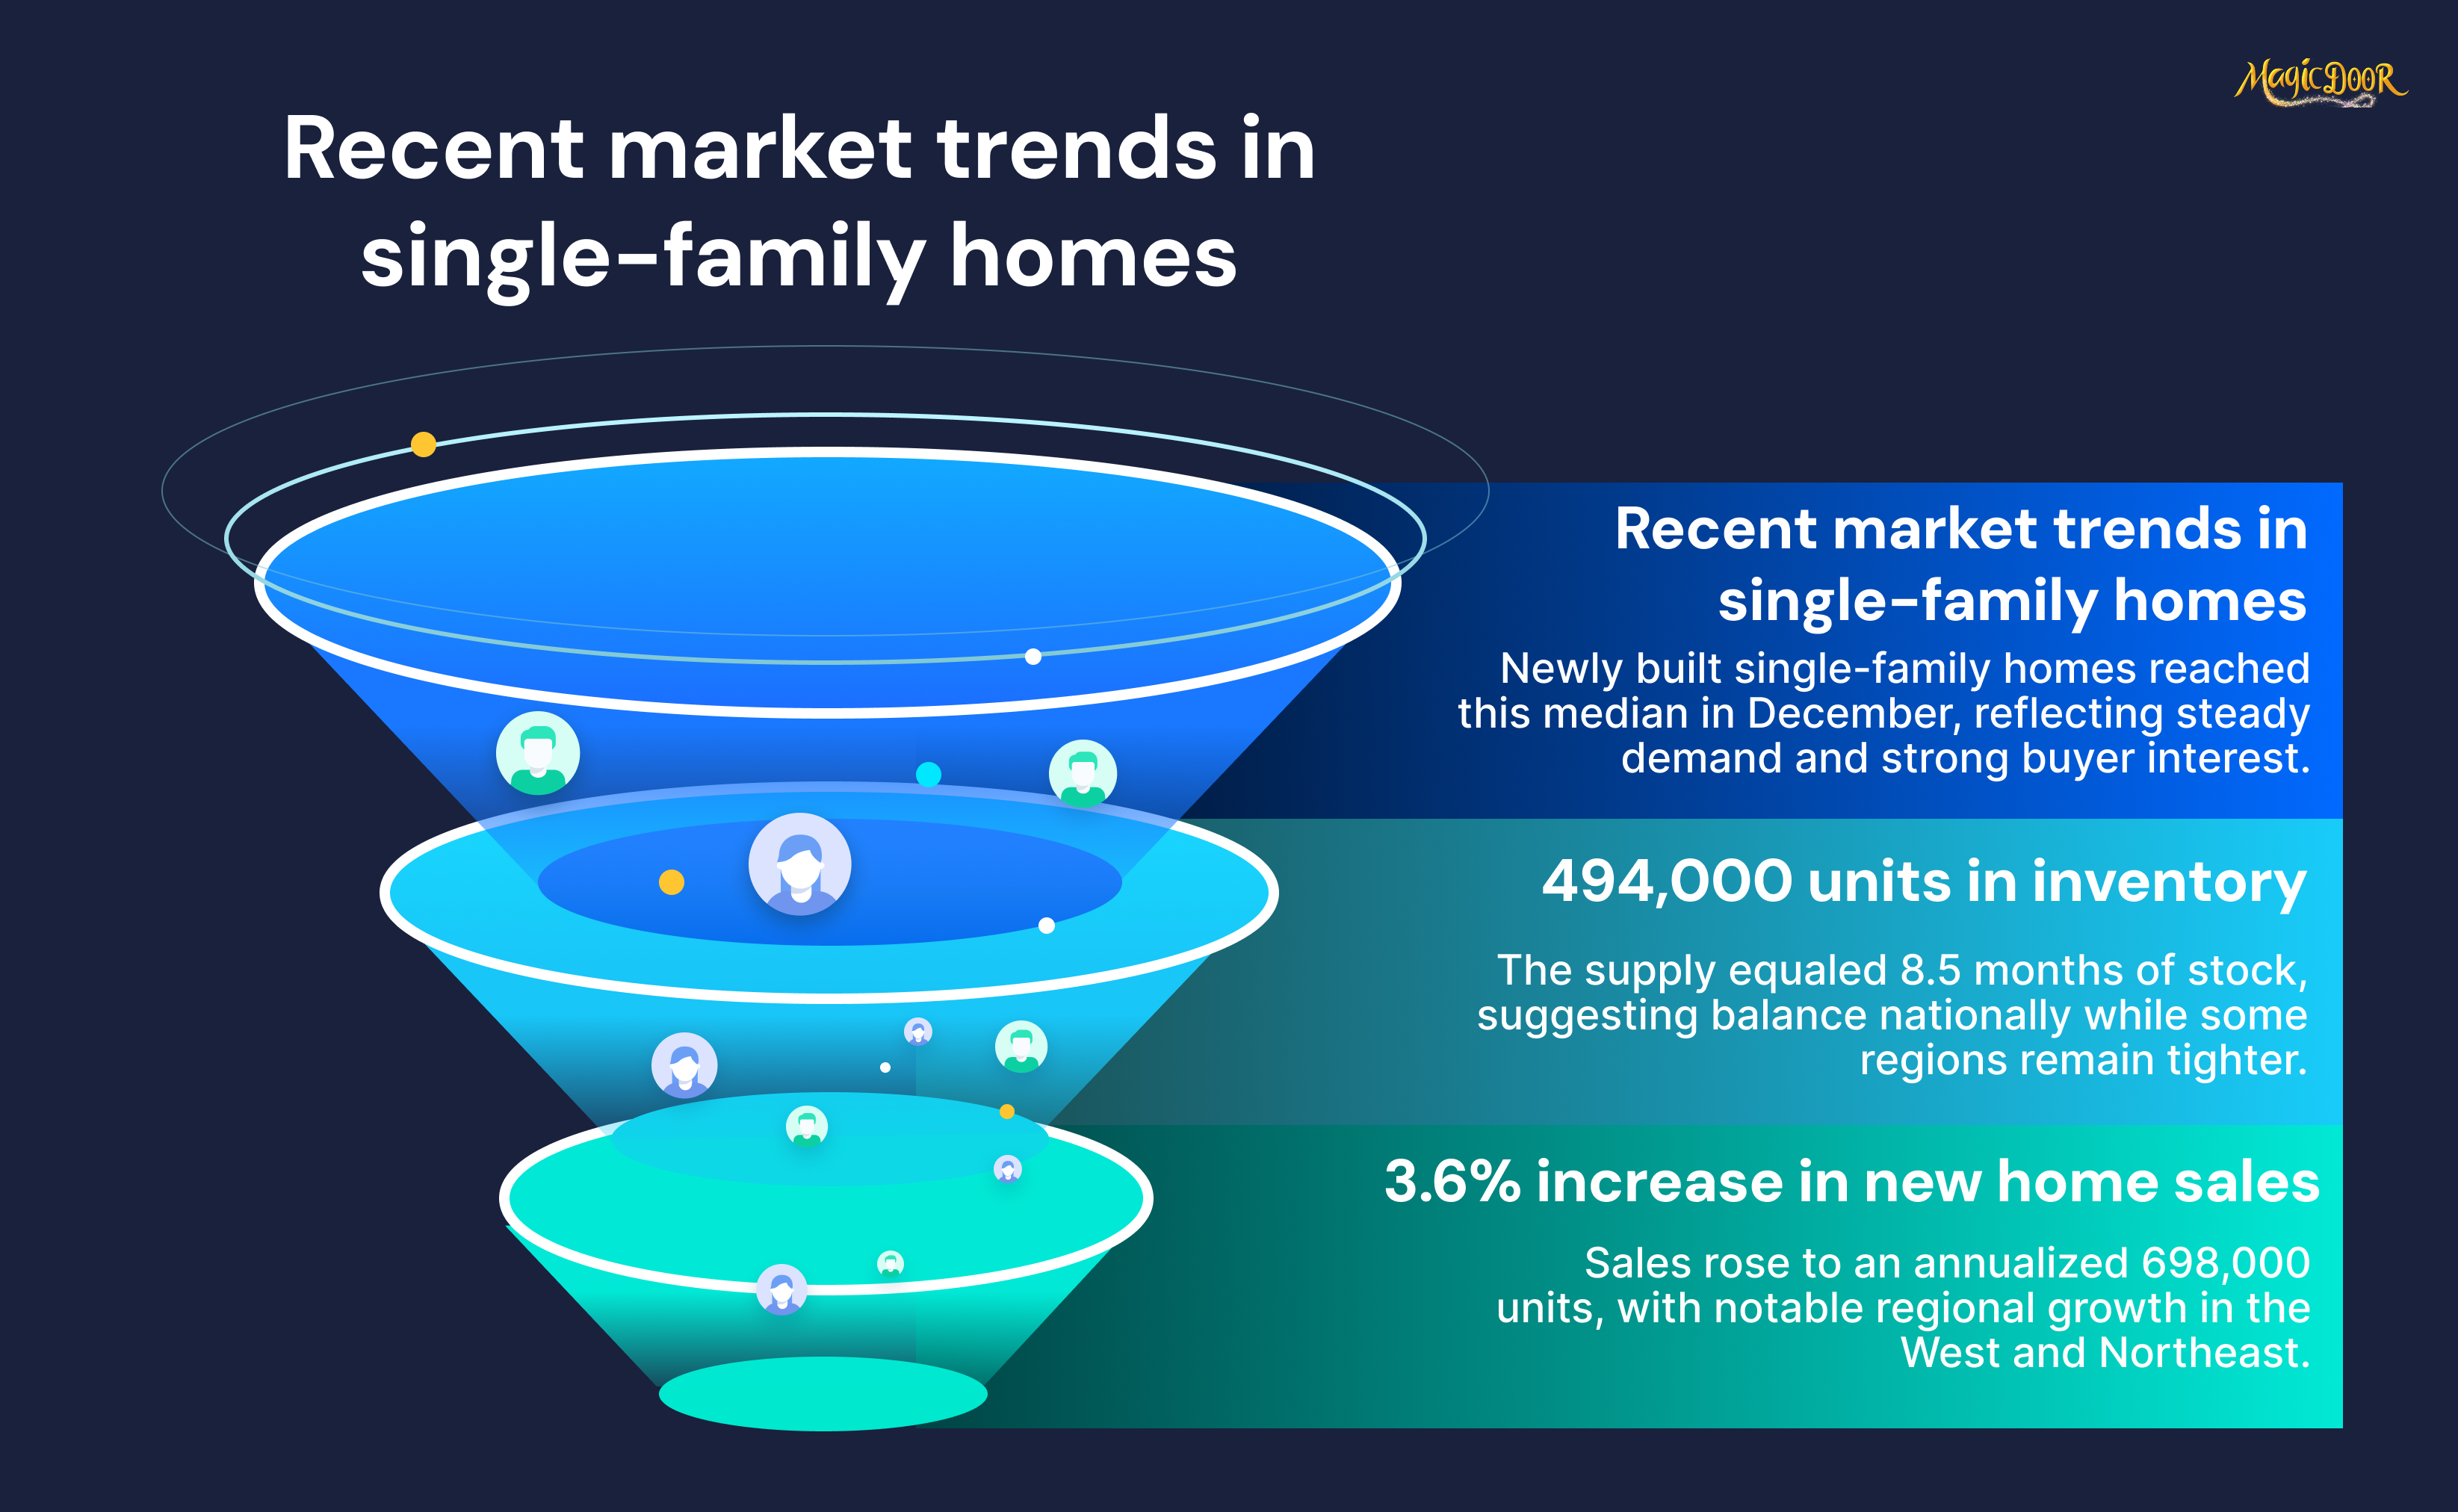
- In December, the median sale price of newly built single-family homes reached $427,000.
- The average price climbed even higher, hitting $513,600, reflecting the continued preference for larger or more feature-rich properties.
- The inventory stood at 494,000 units, translating to 8.5 months of supply. This suggests the market has sufficient stock for current demand levels, but tight conditions may persist in some regions.
- Sales of newly constructed single-family homes increased by 3.6% in December 2024, reaching an annualized rate of 698,000 units.
- The West and Northeast recorded double-digit growth at 20.3% and 41.7%, respectively.
- Meanwhile, the South and Midwest experienced slight declines, down by 2.1% and 3.3%, emphasizing variances in regional demand.
Regional Variations in Housing Data
- Regional activity: Southern and western U.S. markets are seeing the majority of new starts due to higher demand and lower costs than other regions.
- Large metro suburban counties saw a 25% growth in single-family building permits in Q2 of 2024.
- Micro counties reported a modest increase of 3.4%.
- Growth was notably strong in high-density metro areas, where telework opportunities and shifting lifestyle preferences continue to boost demand.
- Meanwhile, more rural regions reported slower but steady gains in new home construction.
Urban vs. Suburban Single-Family Markets
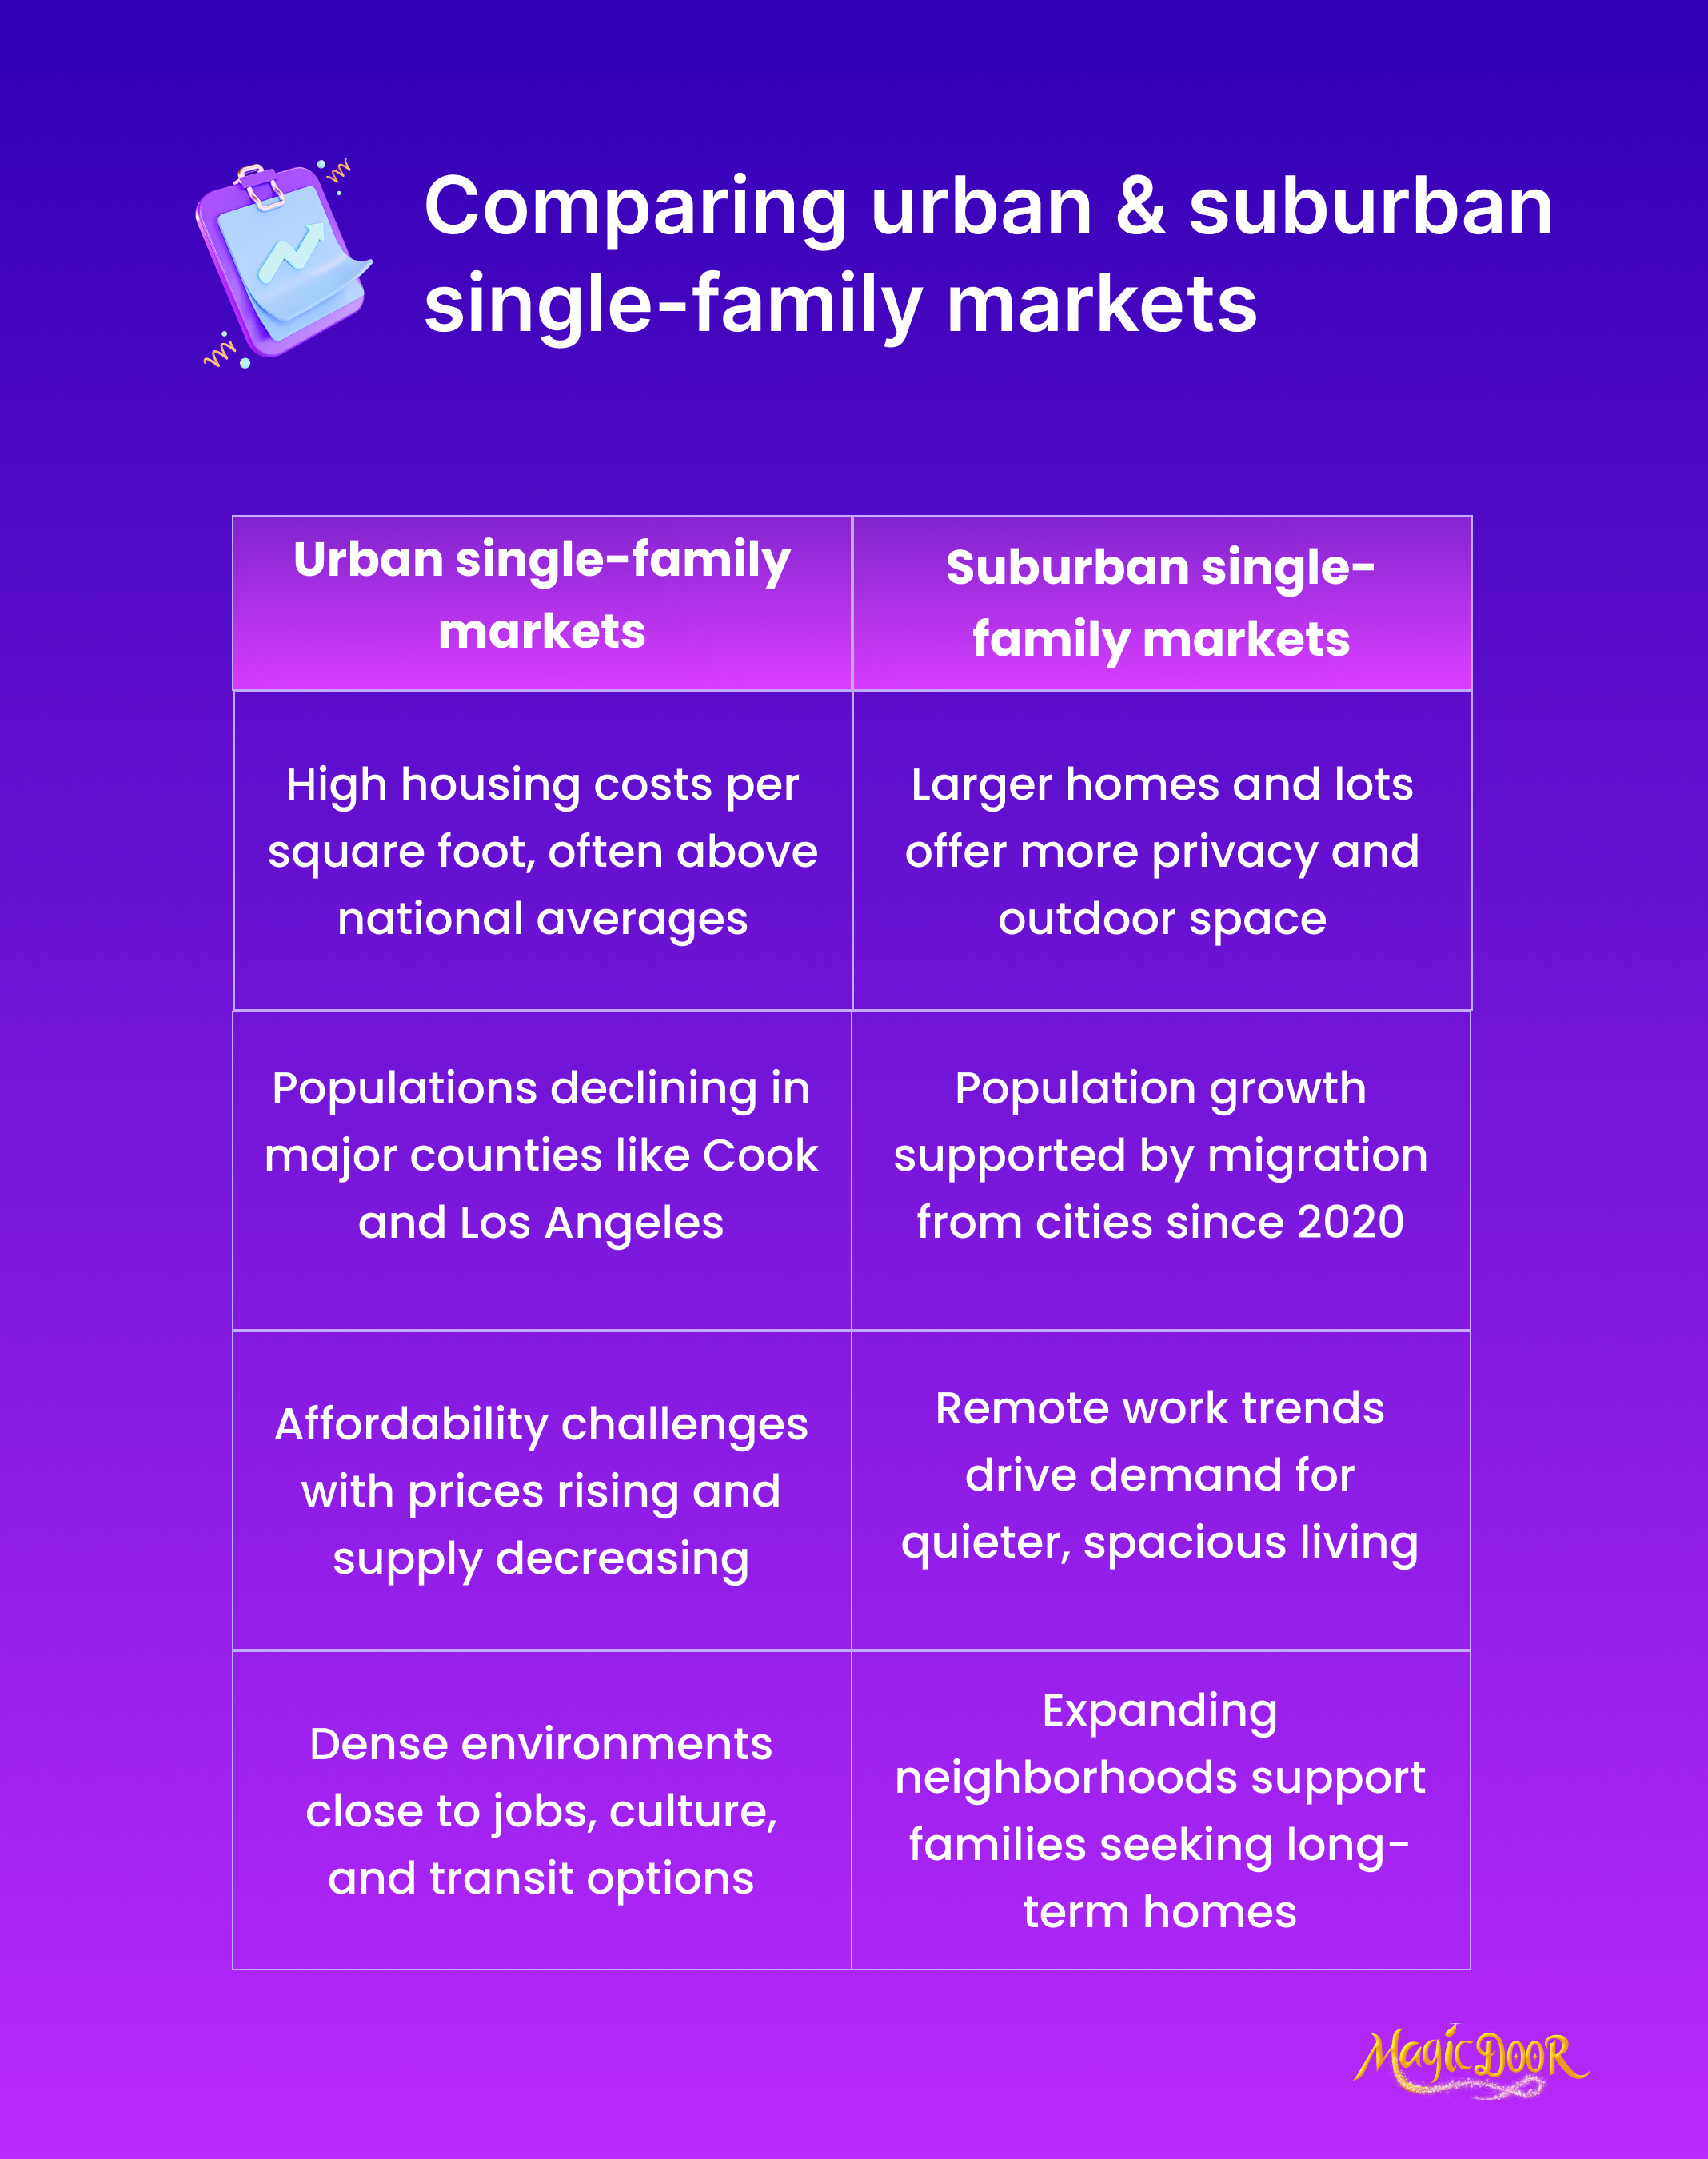
- Over two million people moved from urban counties to suburban or smaller metro areas between 2020 and 2022.
- Cook County, Illinois, saw its population fall by 3%, equal to 166,000 residents, while Los Angeles County experienced a similar 3% decline, losing 300,000 residents.
- In late 2024, the median sale price for single-family homes reached $427,000 nationally. In cities like New York, urban housing costs per square foot exceeded $431, compared to a $203 national average.
- Suburban homes offer larger living spaces, with the average size increasing from 909 square feet in 1949 to 2,480 square feet in 2021. Many also feature expansive lots offering privacy, outdoor options for families, and room for activities.
- The appeal of suburban living continues to grow as remote work trends support the need for quieter, larger homes. By 2025, 22% of American workers are expected to work remotely.
- Urban hubs, while still key economic and cultural zones, present affordability challenges. For example, urban home prices will rise 12% in 2023, and the housing supply will drop 8%.
Emerging Growth Areas
- New single-family housing starts are expected to grow by 13.8%, reaching 1.1 million units in 2025, reflecting a substantial boost in construction activity.
- Modular homes are being completed up to 50% faster than traditional construction, which helps reduce costs while offering buyers customization options.
- Built-to-rent communities are gaining traction, notably in the Midwest and Sunbelt states such as Florida, Texas, and Arizona. These properties maintain high occupancy rates, averaging 95.5%, with demand fueled by rising mortgage rates.
- In 2024, 17% of new homes incorporated sustainable practices, such as solar panels and water-efficient landscaping, which reduced homeowners’ utility expenses.
- Multi-generational housing designs have increased by 12%, catering to families combining resources under one roof while benefiting from added bedrooms and flexible layouts.
- Suburban counties captured 25% of single-family housing permits in 2024, driven by population growth in smaller metros and fringe suburban areas.
Single-Family Home Prices

- Moderate price growth: Median home prices are predicted to rise by 2%-4%, with the national median price estimated at $410,700.
- Regional prices vary: The Southwest remains more affordable, while the Northeast sees higher price tags. Competitive cities like Boston and Denver may see slight price increases.
- Luxury segment stability: High-end homes are holding steady, with fewer fluctuations in markets like California and Florida.
- Price growth plateau: After years of steep increases, slower price growth reflects improving inventory levels.
- First-time buyers: Challenges persist for new buyers, with high prices requiring larger down payments.
Single-Family Inventory
- Rising supply: Inventory levels are up 27% from the previous year, giving buyers more options.
- Monthly supply improvements: The supply of single-family homes has increased to 4.1 months, moving closer to the balanced market range of 4-6 months.
- More sellers: New listings increased by 14% as more homeowners chose to sell, signaling greater confidence in the market.
- Balanced market: The growing inventory brings the market closer to balance, reducing the intense competition seen in previous years.
- Regional differences: The Midwest and Northeast see tighter inventory levels, while Southern states experience more significant increases.
Higher inventory levels mean buyers have more negotiating power and may need to price competitively. A balanced market benefits both parties and reduces bidding wars.
Regional Analysis of the U.S. Single-Family Market in 2025
While national trends often dominate the conversation around real estate, regional differences tell the true story behind the housing market dynamics. The Northeast, South, Midwest, and West present unique trends with varying opportunities and challenges in the single-family home market.
Here’s what you need to know.
Northeast
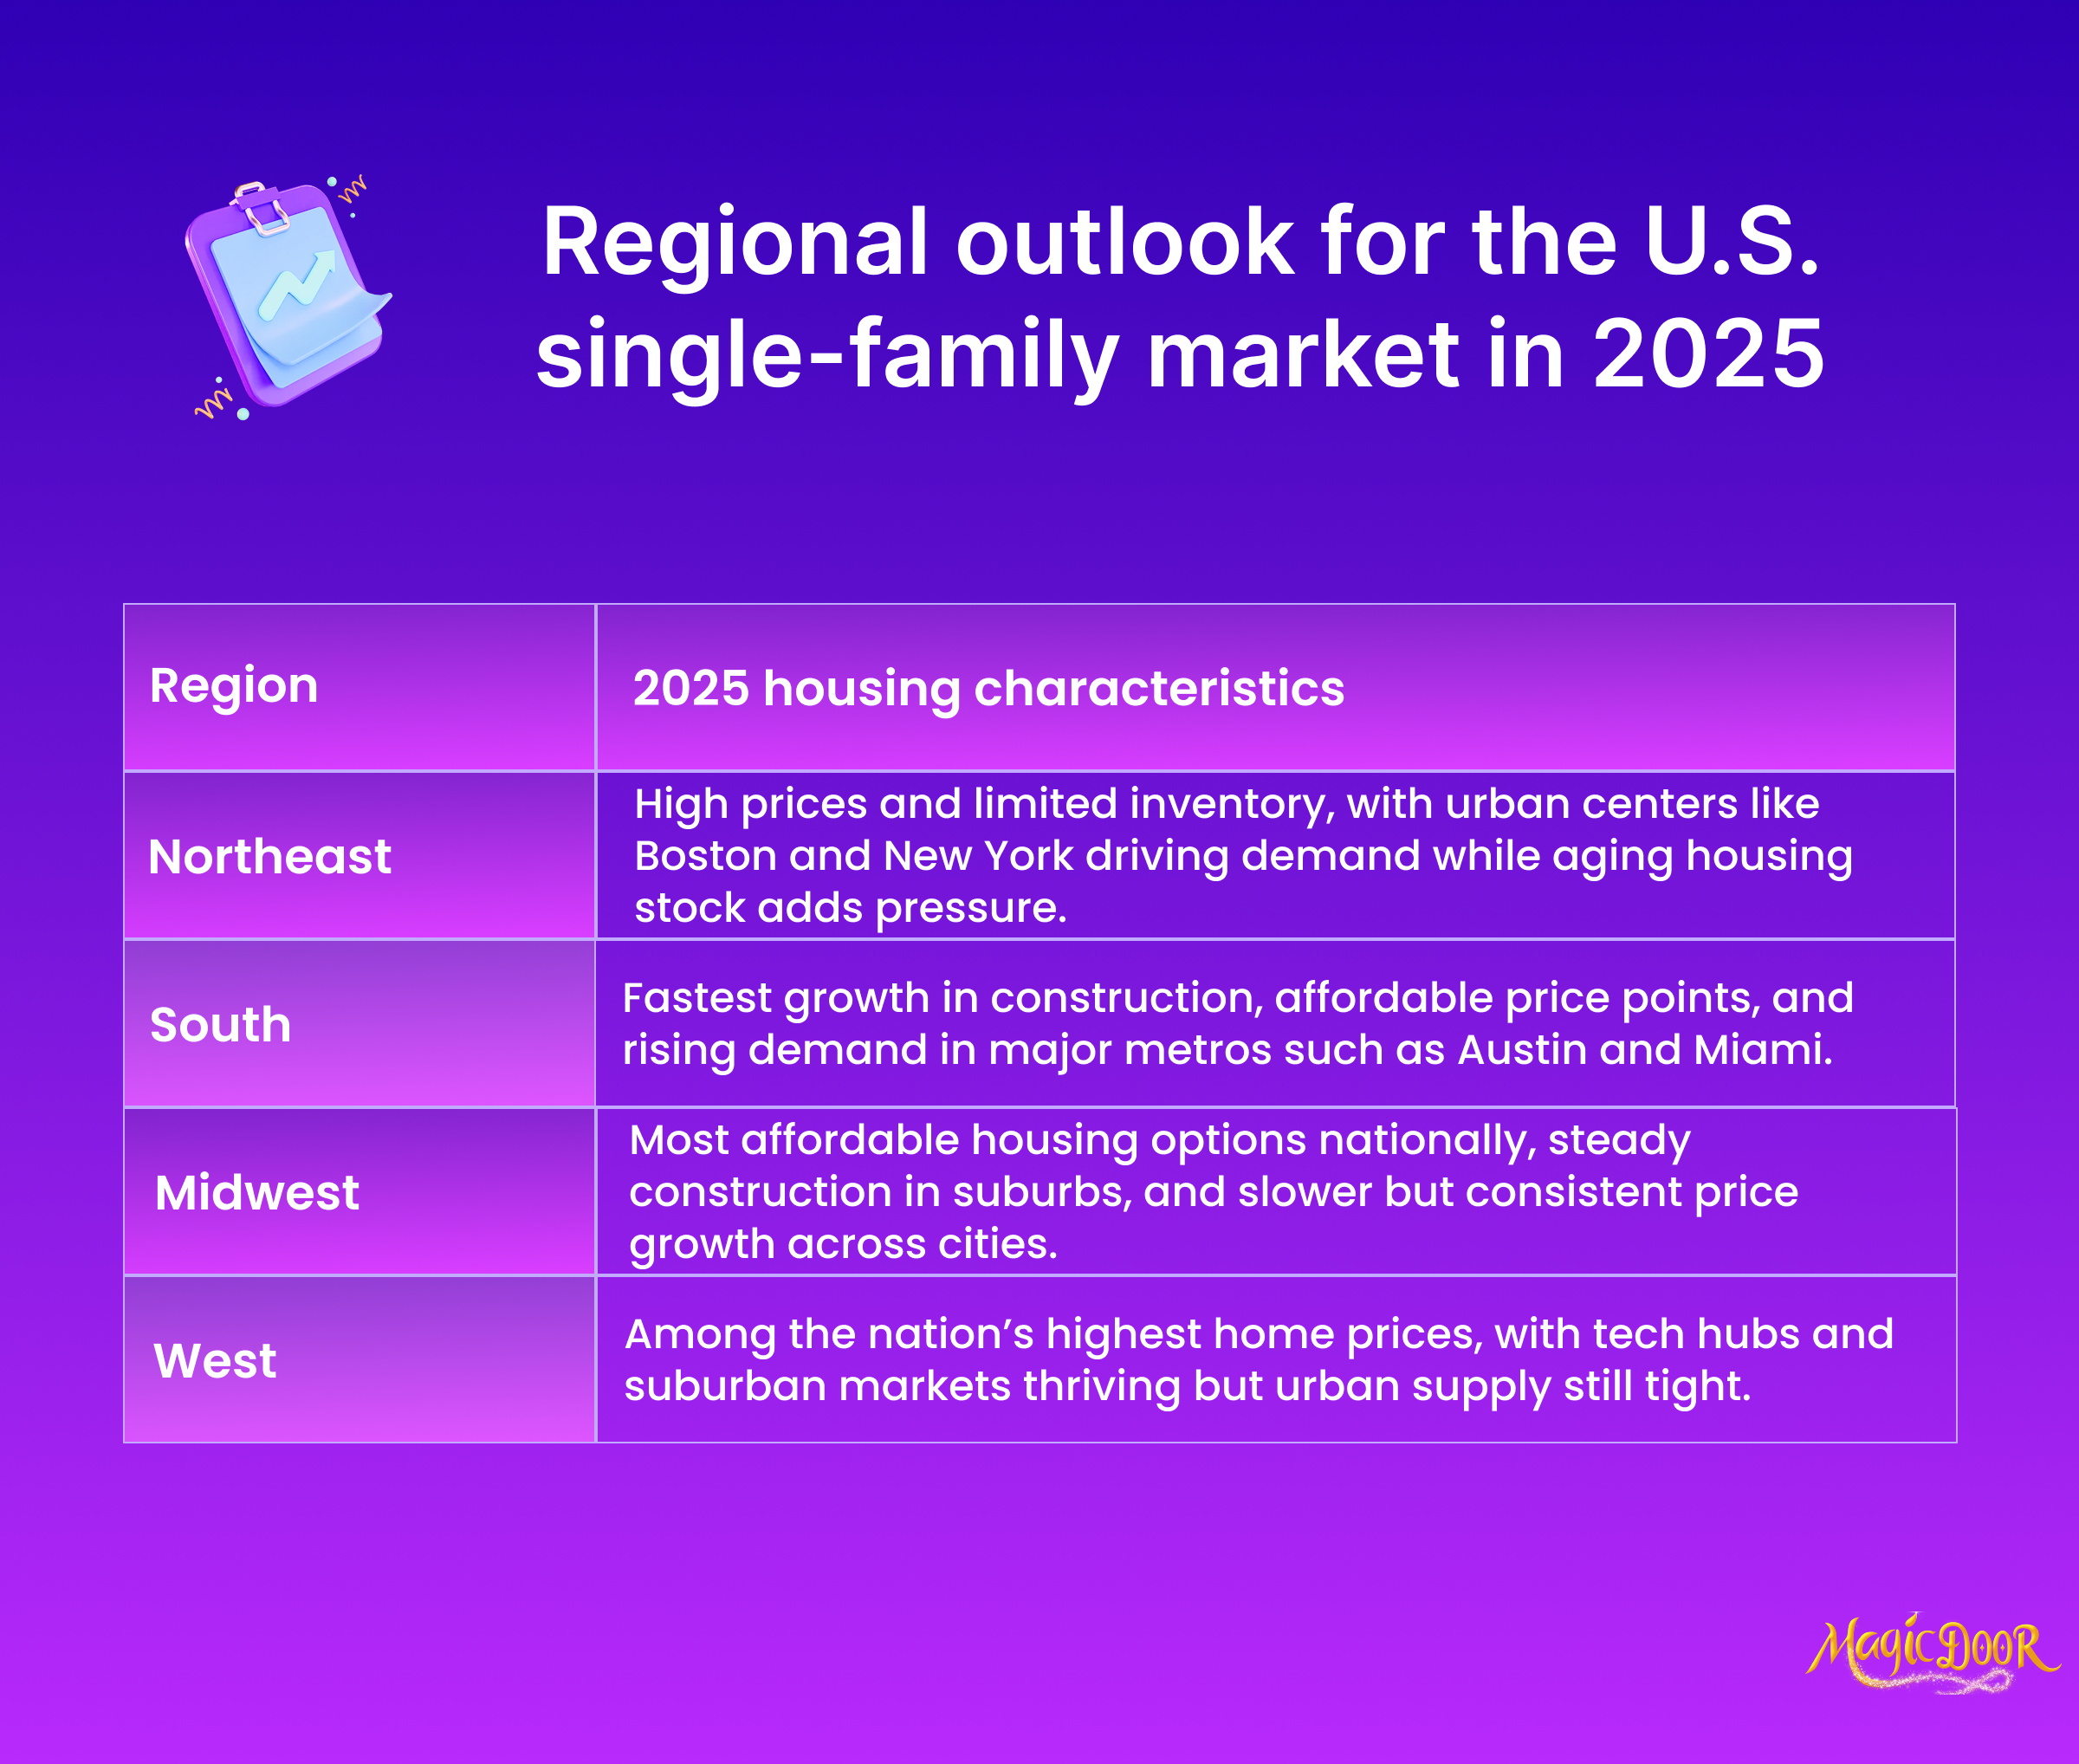
The Northeast remains one of the most expensive regions for single-family housing. Tight inventory, high appeal in urban centers, and an aging housing stock contribute to rising prices.
- Housing starts: New construction in the Northeast has lagged behind other regions, with developers facing strict zoning laws and high building costs.
- Home prices: Median home prices in cities like Boston and New York continue to climb, reaching well above the national average. Some suburban and rural areas are seeing more modest price growth, offering slight relief to buyers.
- Inventory: Inventory levels in the Northeast remain tight, with only modest increases compared to other regions. Due to high need, the supply of homes often gets absorbed quickly.
Limited inventory and high prices mean fierce competition for buyers. Vendors benefit from this strong demand, but due to the age of many regional homes, they may need to invest in upgrades.
First-time buyers face an uphill battle unless they consider smaller, less competitive towns.
South
The South continues to attract people due to its affordability, milder climate, and job growth. This region is a hotbed for new single-family construction driven by strong population growth.
- Housing starts: The South leads the nation in new home construction, with states like Texas, Florida, and Georgia showing the fastest growth. Builders are capitalizing on ample land and favorable regulations.
- Home prices: Compared to the rest of the country, prices in the South remain relatively affordable, although metropolitan hubs like Austin and Miami are seeing price increases due to high migration and investment.
- Inventory: Inventory levels are rising steadily, easing some pressure on buyers. However, in fast-growing cities, need still outpaces supply.
Buyers find the South more attractive due to a range of price points and growing housing options. Vendors in competitive areas may still see bidding wars, while those in smaller towns might face slower sales as inventory rises.
Investors continue to target the region as it grows economically and demographically.
Midwest
Known for its affordability, the Midwest offers stability in an otherwise unpredictable housing market. This region has emerged as a refuge for buyers priced out of coastal states.
- Housing starts: Construction activity in the Midwest is modest but steady, reflecting stable demand. However, builders tend to focus on suburban areas rather than urban cores.
- Home prices: The Midwest features some of the lowest median home prices in the country. Cities like Cleveland and St. Louis remain affordable, with slower price growth than other regions.
- Inventory: Inventory levels have improved slightly, though some cities face challenges due to aging housing stock and slower new construction.
For buyers, the Midwest continues to offer the most affordable options and relatively less competition. Sellers may experience slower sales due to the stable nature of the market, but they benefit from consistent needs from local and relocating buyers.
West
The Western states have a unique mix of booming tech hubs and scenic rural areas, creating a complicated housing dynamic. While home prices in this region are among the highest, inventory levels and demand vary widely.
- Housing starts: Western states are seeing moderate growth in housing starts, with a focus on suburban developments. However, disasters like wildfires and stricter regulations pose challenges for developers.
- Home prices: California cities like San Francisco and Los Angeles remain some of the most expensive markets in the country, pushing buyers toward less costly options in states like Nevada and Arizona.
- Inventory: While inventory is improving in many markets, some urban areas still struggle with supply shortages, making it tough for buyers.
Buyers in the West may find it challenging to enter competitive markets, especially in major coastal cities. Sellers in high-demand suburban areas will likely thrive, while those in rural and disaster-prone regions may need to adjust prices for faster sales.
Why Regional Differences Exist in Real Estate
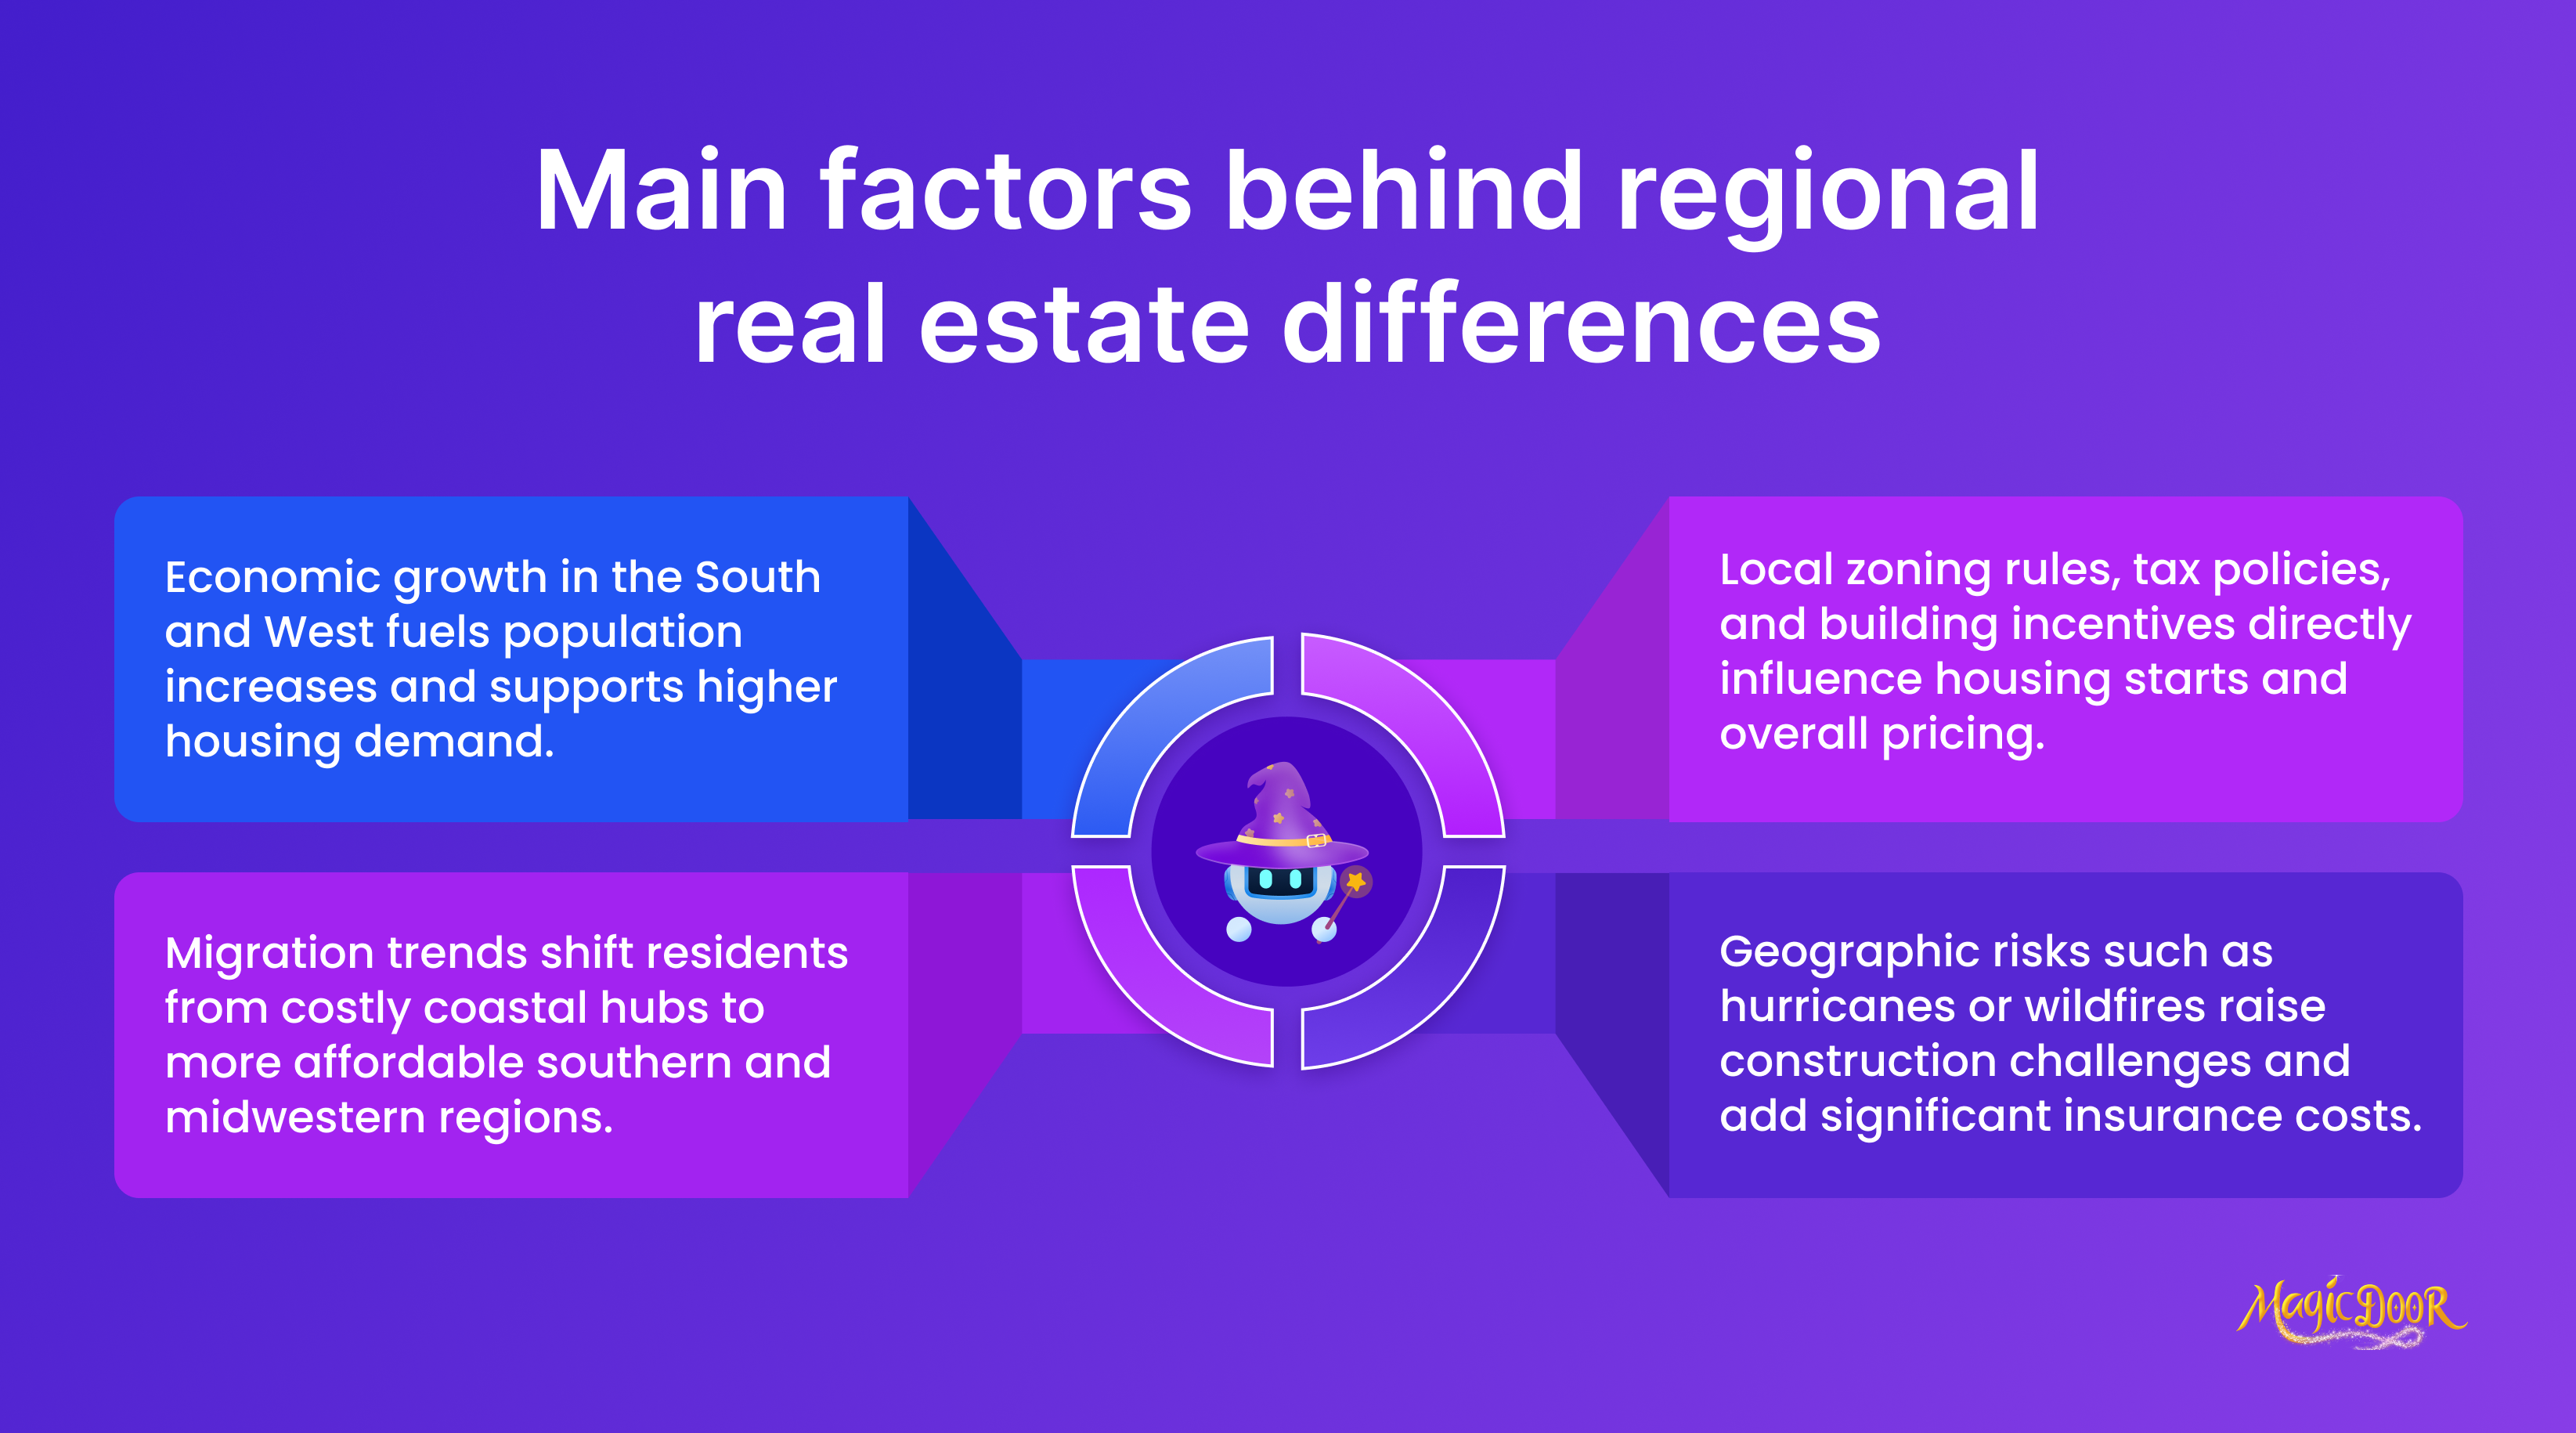
Several factors drive these regional variations:
- Economic growth: Rapid job growth in the South and West draws in new residents, boosting housing demand and construction activity.
- Population trends: Migration patterns play a significant role. People continue to leave expensive coastal cities for more affordable areas in the South and Midwest.
- Local policies: Zoning laws, tax regulations, and building incentives differ widely by state and city, influencing housing starts and price dynamics.
- Geographic challenges: Environmental factors, such as hurricanes in the South or wildfires in the West, affect construction and insurance costs.
Conclusion
The single-family market in 2025 offers hope for buyers with more available inventory and slower price growth. However, affordability challenges remain due to still-elevated mortgage rates and rising construction costs.
The increase in home starts and more balanced inventory are steps in the right direction for a healthier housing market.